Hypothesis Testing – Two Samples
Hypothesis Testing – Two Samples. Chapters 12 & 13. Chapter Topics. Comparing Two Independent Samples Independent samples Z test for the difference in two means Pooled-variance t test for the difference in two means F Test for the Difference in Two Variances


Hypothesis Testing – Two Samples
E N D
Presentation Transcript
Hypothesis Testing – Two Samples Chapters 12 & 13
Chapter Topics • Comparing Two Independent Samples • Independent samples Z test for the difference in two means • Pooled-variance t test for the difference in two means • F Test for the Difference in Two Variances • Comparing Two Related Samples • Paired-sample Z test for the mean difference • Paired-sample t test for the mean difference • Two-sample Z test for population proportions • Independent and Dependent Samples
Comparing Two Independent Samples • Different Data Sources • Unrelated • Independent • Sample selected from one population has no effect or bearing on the sample selected from the other population • Use the Difference between 2 Sample Means • Use Z Test or t Test for Independent Samples
Independent Sample Z Test (Variances Known) • Assumptions • Samples are randomly and independently drawn from normal distributions • Population variances are known • Test Statistic
t Test for Independent Samples (Variances Unknown) • Assumptions • Both populations are normally distributed • Samples are randomly and independently drawn • Population variances are unknown but assumed equal • If both populations are not normal, need large sample sizes
Developing the t Test for Independent Samples • Setting Up the Hypotheses H0: m 1 = m 2H1: m 1¹m 2 H0: m 1 -m 2 = 0 H1: m 1 - m 2 ¹ 0 Two Tail OR H0: m 1£ m 2H1: m 1 > m 2 H0: m 1 - m 2£ 0 H1: m 1 - m 2> 0 Right Tail OR H0: m 1³ m 2 H0: m 1 - m 2³ 0 H1: m 1 - m 2 < 0 Left Tail OR H1: m 1 < m 2
Developing the t Test for Independent Samples (continued) • Calculate the Pooled Sample Variance as an Estimate of the Common Population Variance
Developing the t Test for Independent Samples (continued) • Compute the Sample Statistic Hypothesized difference
You’re a financial analyst for Charles Schwab. Is there a difference in average dividend yield between stocks listed on the NYSE & NASDAQ? You collect the following data: NYSENASDAQNumber 21 25 Sample Mean 3.27 2.53 Sample Std Dev 1.30 1.16 Assuming equal variances, isthere a difference in average yield (a= 0.05)? t Test for Independent Samples: Example © 1984-1994 T/Maker Co.
H0: m1 - m2 = 0 i.e. (m1 = m2) H1: m1 - m2 ¹ 0 i.e. (m1¹ m2) a= 0.05 df = 21 + 25 - 2 = 44 Critical Value(s): Solution Test Statistic: Decision: Conclusion: Reject H Reject at a = 0.05. Reject H 0 0 .025 .025 There is evidence of a difference in means. t -2.0154 0 2.0154 2.03
p -Value Solution (p-Value is between .02 and .05) < (a = 0.05) Reject. p-Value 2 is between .01 and .025 Reject Reject a2 =.025 0 Z -2.0154 2.0154 2.03 Test Statistic 2.03 is in the Reject Region
You’re a financial analyst for Charles Schwab. You collect the following data: NYSENASDAQNumber 21 25 Sample Mean 3.27 2.53 Sample Std Dev 1.30 1.16 Example You want to construct a 95% confidence interval for the difference in population average yields of the stocks listed on NYSE and NASDAQ. © 1984-1994 T/Maker Co.
Independent Sample (Two Sample) t- Test in JMP • Independent Sample t Test with Variances Known • Analyze | Fit Y by X | Measurement in Y box (Continuous) | Grouping Variable in X box (Nominal) | | Means/Anova/Pooled t
Comparing Two Related Samples • Test the Means of Two Related Samples • Paired or matched • Repeated measures (before and after) • Use difference between pairs • Eliminates Variation between Subjects
Z Test for Mean Difference (Variance Known) • Assumptions • Both populations are normally distributed • Observations are paired or matched • Variance known • Test Statistic
t Test for Mean Difference (Variance Unknown) • Assumptions • Both populations are normally distributed • Observations are matched or paired • Variance unknown • If population not normal, need large samples • Test Statistic
Assume you work in the finance department. Is the new financial package faster (a=0.05 level)? You collect the following processing times: Dependent-Sample t Test: Example UserExisting System (1)New Software (2)DifferenceDi C.B. 9.98 Seconds 9.88 Seconds .10 T.F. 9.88 9.86 .02 M.H. 9.84 9.75 .09 R.K. 9.99 9.80 .19 M.O. 9.94 9.87 .07 D.S. 9.84 9.84 .00 S.S. 9.86 9.87 - .01 C.T. 10.12 9.98 .14 K.T. 9.90 9.83 .07 S.Z. 9.91 9.86 .05
Is the new financial package faster (0.05 level)? Dependent-Sample t Test: Example Solution H0: mD £0 H1: mD>0 Reject a =.05 D = .072 a =.05 Critical Value=1.8331df = n - 1 = 9 1.8331 3.66 Decision: Reject H0 t Stat. in the rejection zone. Test Statistic Conclusion: The new software package is faster.
Confidence Interval Estimate for of Two Dependent Samples • Assumptions • Both populations are normally distributed • Observations are matched or paired • Variance is unknown • Confidence Interval Estimate:
Assume you work in the finance department. You want to construct a 95% confidence interval for the mean difference in data entry time. You collect the following processing times: Example UserExisting System (1)New Software (2)DifferenceDi C.B. 9.98 Seconds 9.88 Seconds .10 T.F. 9.88 9.86 .02 M.H. 9.84 9.75 .09 R.K. 9.99 9.80 .19 M.O. 9.94 9.87 .07 D.S. 9.84 9.84 .00 S.S. 9.86 9.87 - .01 C.T. 10.12 9.98 .14 K.T. 9.90 9.83 .07 S.Z. 9.91 9.86 .05
F Test for Difference in Two Population Variances • Test for the Difference in 2 Independent Populations • Parametric Test Procedure • Assumptions • Both populations are normally distributed • Test is not robust to this violation • Samples are randomly and independently drawn
The F Test Statistic = Variance of Sample 1 n1 - 1 = degrees of freedom = Variance of Sample 2 n2 - 1 = degrees of freedom 0 F
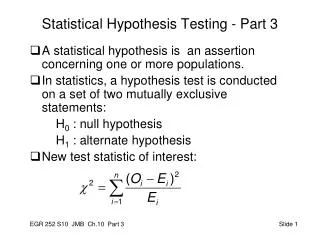
Developing the F Test • Hypotheses • H0: s12 = s22 • H1: s12¹ s22 • Test Statistic • F = S12 /S22 • Two Sets of Degrees of Freedom • df1 = n1 - 1; df2 = n2 - 1 • Critical Values: FL( ) and FU( ) FL = 1/FU* (*degrees of freedom switched) Reject H0 Reject H0 Do Not Reject a/2 a/2 0 FL FU F n1 -1, n2 -1 n1 -1 , n2 -1
Developing the F Test • Easier Way • Put the largest in the num. • Test Statistic • F = S12 /S22 Reject H0 Do Not Reject a 0 F F
Assume you are a financial analyst for Charles Schwab. You want to compare dividend yields between stocks listed on the NYSE & NASDAQ. You collect the following data: NYSENASDAQNumber 21 25 Mean 3.27 2.53 Std Dev 1.30 1.16 Is there a difference in the variances between the NYSE & NASDAQ at the a = 0.05 level? F Test: An Example © 1984-1994 T/Maker Co.
F Test: Example Solution • Finding the Critical Values for a = .05
H0:s12 = s22 H1: s12¹s22 a=.05 df1=20 df2=24 Critical Value(s): F Test: Example Solution Test Statistic: Decision: Conclusion: Do not reject at a = 0.05. Reject .05 There is insufficient evidence to prove a difference in variances. F 0 2.33 1.25
F Test: One-Tail H0: s12³s22 H0: s12£ s22 or • H1: s12 > s22 • H1: s12< s22 a = .05 Degrees of freedom switched Reject Reject a = .05 a = .05 F F 0 0
F Test: One-Tail • Easier Way • Put the largest in the num. • Test Statistic • F = S12 /S22 Reject H0 Do Not Reject a 0 F F
Z Test for Differences in Two Proportions (Independent Samples) • What is It Used For? • To determine whether there is a difference between 2 population proportions and whether one is larger than the other • Assumptions: • Independent samples • Population follows binomial distribution • Sample size large enough: np 5 and n(1-p) 5 for each population
The Hypotheses for the Z Test Research Questions No Difference Prop 1 Prop 2 Prop 1 Prop 2 Hypothesis Any Difference Prop 1 < Prop 2 Prop 1 > Prop 2 - p p = 0 p - p 0 p - p 0 H 1 2 1 2 1 2 0 - p - p < 0 p p > 0 p - p 0 H 1 2 1 2 1 2 1
As personnel director, you want to test the perception of fairness of two methods of performance evaluation. 63 of 78 employees rated Method 1 as fair. 49 of 82 rated Method 2 as fair. At the 0.01 significance level, is there a difference in perceptions? Z Test for Differences in Two Proportions: Example
H0: p1 - p2 = 0 H1: p1 - p2 0 = 0.01 n1 = 78 n2 = 82 Critical Value(s): Z Test for Differences in Two Proportions: Solution Test Statistic: Decision: Conclusion: Z 2 . 90 Reject at = 0.01. Reject H Reject H 0 0 There is evidence of a difference in proportions. .005 .005 0 Z -2.58 2.58
Confidence Interval for Differences in Two Proportions • The Confidence Interval for Differences in Two Proportions
Confidence Interval for Differences in Two Proportions: Example As personnel director, you want to find out the perception of fairness of two methods of performance evaluation. 63 of 78 employees rated Method 1 as fair. 49 of 82 rated Method 2 as fair. Construct a 99% confidence interval for the difference in two proportions.
Confidence Interval for Differences in Two Proportions: Solution We are 99% confident that the difference between two proportions is somewhere between 0.0294 and 0.3909.
Z Test for Differences in Two Proportions (Dependent Samples) • What is It Used For? • To determine whether there is a difference between 2 population proportions and whether one is larger than the other • Assumptions: • Dependent samples • Population follows binomial distribution • Sample size large enough: np 5 and n(1-p) 5 for each population
Z Test Statistic for Dependent Samples • This Z can be used when a+d>10 • If 10<a+d<20, use the correction in the text
Unit Summary • Compared Two Independent Samples • Performed Z test for the differences in two means • Performed t test for the differences in two means • Performed Z test for differences in two proportions • Addressed F Test for Difference in Two Variances
Unit Summary • Compared Two Related Samples • Performed dependent sample Z tests for the mean difference • Performed dependent sample t tests for the mean difference • Performed Z tests for proportions using dependent samples