Download
1 / 12
120 likes | 296 Vues
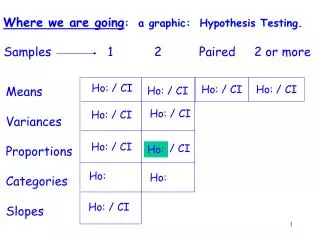
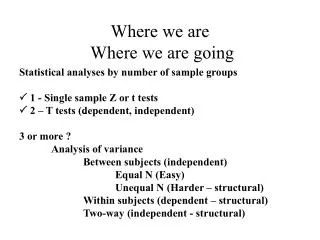
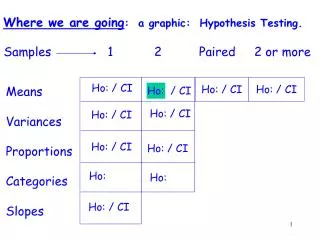
Where we are going : a graphic: Hypothesis Testing. Samples. 1 2 Paired 2 or more. Ho: / CI. Ho: / CI. Ho: / CI. Means Variances Proportions Categories Slopes. Ho: / CI. Ho: / CI. Ho: / CI. Ho: / CI. Ho: / CI. Ho:. Ho:. Ho: / CI.

E N D
Where we are going: a graphic: Hypothesis Testing. Samples 1 2 Paired 2 or more Ho: / CI Ho: / CI Ho: / CI Means Variances Proportions Categories Slopes Ho: / CI Ho: / CI Ho: / CI Ho: / CI Ho: / CI Ho: Ho: Ho: / CI
Two Sample: Hypothesis testing. Gather data Population 1 Sample 1 Make comparisons Population 2 Sample 2
Hypothesis testing: Same 8 steps (briefly): 1. Research hypothesis (Ha:). 2. Null hypothesis (Ho:). 3. A. State type I error. B. State type II error. 4. State , (the probability of type I error). 5. Draw the rejection region; state rejection criterion. 6. Compute the test statistic. 7. Make a decision about Ho:. 8. State a conclusion.
Hypotheses about two means. Chapter 6 (Pulse rate example with equal variances). Consider the following research question: Does modest exercise increase the mean pulse rate among graduate students at Clemson University ? 128 randomly selected graduate students will be divided into two groups. Group 1 will do 3 stand ups and group 2 will rest. 15 second pulse rates will be taken and the averages compared.
Hypotheses about two means. Continued, 1 1. Research (alternate) hypothesis: Ha: e>r . 2. Null hypotheses: Ho: er . 3. A. Type I error: Claim pulse rate is greater when in fact it is not (reject Ho|Ho is true). B. Type II error: Claim pulse rate is the same when in fact it is not (accept Ho|Ho is false).
Hypotheses about two means. Continued, 2. 4. Type I error tolerated: let = .05. 5. Rejection Region: .05 t ,(n1+n2-2) = t.05,126= 1.645 Reject Ho if tc is greater than 1.645 or Reject Ho if p-value <
Hypotheses about two means. Continued, 3. 6. Test statistic: (equal variances)
The experiment was done and the data are listed below. Exercise group Resting group 20 21 23 21 20 17 20 21 16 20 20 22 21 18 21 18 23 22 21 22 19 17 22 18 18 18 20 23 21 19 26 20 19 22 20 19 19 21 20 23 19 20 16 18 16 21 26 16 22 21 21 21 21 20 22 22 20 21 20 22 18 18 22 20 21 19 19 18 26 23 16 24 21 19 20 18 20 19 16 21 21 22 15 17 22 17 18 22 19 20 19 18 22 20 20 21 18 15 21 20 22 20 18 14 22 20 18 20 24 21 22 20 19 17 22 19 19 19 18 16 19 19 20 23 21 16 14 22
The following were the results: Group Number mean variance exercise 60 20.58 5.43 rest 68 19.26 4.35
Hypotheses about two means. Continued, 5. So: 6. 7. Decision: Since 3.38 > 1.645 , Reject Ho: (plot 3.38 on the drawing in 5) in favor of Ha:.
Hypotheses about two means. Continued, 6. 8. Conclusion. A recent study of 128 randomly selected students showed that average 15 second pulse rate increased with slight exercise. We are 95% certain our answer is correct; or, there is a 5% chance we have rejected incorrectly. If the null is in fact correct, 5 out of 100 studies done in this way will lead to rejection.
Three kinds of research/null hypotheses: Rejection region for t: I. Ha: 1 < 2 Ho: 1 2 0 II. Ha: 1 > 2 Ho: 1 2 0 III. Ha: 1 2 /2 /2 Ho: 1= 2 0