Firms and Production
210 likes | 279 Vues
Firms and Production. Perloff Chapter 6. Firms. An organisation that converts inputs into outputs which it sells. Ownership of the firm may be separated from its control creating a potential conflict of interest. Owners aim to maximise profits. Managers may maximise non profit objectives.

Firms and Production
E N D
Presentation Transcript
Firms and Production Perloff Chapter 6
Firms • An organisation that converts inputs into outputs which it sells. • Ownership of the firm may be separated from its control creating a potential conflict of interest. • Owners aim to maximise profits. • Managers may maximise non profit objectives.
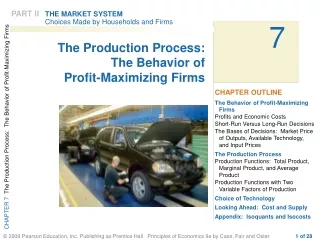
Production Function The relationship between the quantities of inputs and the maximum level of output produced. Short-run: the period of time in which at least one input is fixed. Long-run: the period of time in which all inputs are variable.
Total product, marginal product and average product in the SR Source: Perloff
Output, q , Units per day C Production relationships in the SR 110 90 B 56 A 0 4 6 11 L , Workers per day AP , MP L L a 20 b 15 Average product, AP L Marginal product, MP L c 0 4 6 11 Source: Perloff , Workers per day L
The long-run: 2 inputs variable Source: Perloff
Isoquant map K , Units of capital per day Combinations of inputs which can be used to produce the same level of output. a 6 b 3 c f e 2 q = 35 d 1 q = 24 q = 14 Source: Perloff L , Workers per day 0 1 2 3 6
K a 6 b 3 c f e 2 q = 35 d 1 q = 24 q = 14 L 0 1 2 3 6 Properties of Isoquants • Further from the origin:higher output • Cannot cross • Slope downward • Convex to the origin Source: Perloff
Substitutability of inputs 1 y , Dutch potatoes per day q = 1 q = 2 q = 3 x , British potatoes per day Source: Perloff
Substitutability of inputs 2 Boxes per day q = 3 q = 2 q = 1 45 ° line Cereal per day Source: Perloff
Marginal rate of technical substitution K , Units of capital per year a 39 = – D K 18 b 21 = D L 1 – 7 c 14 1 – 4 d 10 e 1 – 2 8 q = 10 1 Source: Perloff 0 2 3 4 5 6 L , Workers per day
Constant Returns to Scale Constant returns to scale: Doubling all inputs leads to a doubling of output. Potato Salad Production:
Returns to scale in the Cobb-Douglas Production Function Constant returns to scale Increasing returns to scale Decreasing returns to scale
Example: Thread Mill a+b=0.82 K , Units of capital per year 600 q = 200 q = 177 500 q = 100 400 300 200 100 0 50 100 150 200 250 300 350 400 450 500 Source: Perloff L , Units of labor per year
Varying Scale Economies K , Units of capital per year d 8 q = 8 c d : Decreasing returns to scale c 4 q = 6 b 2 b c : Constant returns to scale a 1 q = 3 q = 1 a b : Increasing returns to scale 0 1 2 4 8 L , Work hours per year Source: Perloff
Technical Progress An increase in the volume of output produced with the same volume of inputs.
q = 11 q = 10 Neutral technical progress K , Units of capital per year 39 21 14 10 8 Source: Perloff 0 2 3 4 5 6 L , Workers per day
q = 11 q = 10 Non-neutral technical progress K , Units of Results in the substitution of one input for another. 39 21 14 10 8 Source: Perloff 0 2 3 4 5 6 L , Workers per day