Download
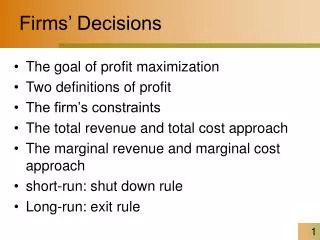
1 / 11
120 likes | 259 Vues
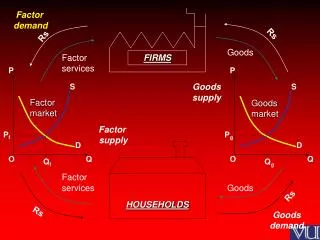
Factor demand. Rs. Rs. Goods. Factor services. FIRMS. P. P. Goods supply. S. S. Factor market. Goodsmarket. Factor supply. P f. P g. D. D. O. Q. O. Q. Q f. Q g. Factor services. Goods. Rs. HOUSEHOLDS. Rs. Goods demand. Backward-bending labor supply curve.

E N D
Factor demand Rs Rs Goods Factor services FIRMS P P Goods supply S S Factor market Goodsmarket Factor supply Pf Pg D D O Q O Q Qf Qg Factor services Goods Rs HOUSEHOLDS Rs Goods demand
Backward-bending labor supply curve. Income effect dominates Wage W1 x Substitution effect dominates O H1 Hours worked
Output x Diminishing returns MPPL O Q of Labor
Firm’s demand curve Rs. x MC4 MC3 MC2 W = MCL W1 MCL X MC0 MRPL = VMPL O Q4 Q3 Q1 Q2 Q0 Q of Labor
Surplus for firm Rs. W = MCL W1 Wages MRPL = VMPL O Q1 QL Q0
Rs. Z W1`` W = MCL Y W1` X VMPL MRPL O Q1` Q2 QL
Discounting • Rate of discount = 10% • The formula for discounting is as follows: Xi (1+ r)i where PV is present value Xi is earnings from the investment in the year i r is the rate of discount Σis the sum over i, of the discounted earnings. PV = Σ i i
Present value of machine that generates Rs. 1,000 for four years and then sold as scrap for Rs. 1,000 at the end of year 4? Year 2 Year 3 Year 4 Year 1 1,000 1,000 1,000 2,000 + + = + 1 2 3 4 1.1 1.1 1.1 1.1 1.1 + + + = = 826 751 1366 Rs. 3852 909 If machine costs less than this then Buy, otherwise don’t Buy. Net present value = PV – Purchase cost
A typical information product 0 0 0 0 0
A typical information product TC = 300 x 175 = 52,500 TR = 250 x 175 = 43,750 Profit or loss Loss Loss = 50 x 175 =87,50 Costs AC D Output MR
Can information be profitable? Yes! If the demand curve can be moved. Costs AC D O Output MR