Correlation & Regression
This article explores the fundamental concepts of correlation and regression, two essential statistical methods for analyzing the relationship between random variables. It covers the strength of linear relationships, the correlation coefficient (ρ), and how to calculate covariance, along with hypothesis testing. The text also discusses linear regression models, including predicting dependent variables and understanding the variance explained by independent variables. Additionally, it addresses the significance of the coefficient of determination (R²) and includes practical examples using real data.


Correlation & Regression
E N D
Presentation Transcript
Correlation • Measure the strength of linear relation between 2 random variables (X & Y) • = Corr(X,Y) = Cov(X,Y)/δxδy • = E[(X-μx)(Y-μy)]/[(X- μx)2(Y- μy)2]1/2 • Standardized Cov(X,Y) so -1 1
Strength of • = -1 Perfect Negative linear relation • = 1 Perfect Positive linear relation • = 0 No linear relation • As || increases so does the strength of the relationship
Sample • Cov(X,Y) = 1/(n-1) (xi -x)(yi -y) • Corr(X,Y) = r = • (xi -x)(yi -y)/[(xi -x)2 (yi -y)2]1/2
Hypothesis Test • Null: H0: = 0 • Alternative: HA: 0; reject H0 if t>tn-2,/2 • Alternative: HA: > 0; reject H0 if t > tn-2, • Alternative: HA: < 0; reject H0 if t < -tn-2,
Rank Correlation (Spearman’s) • Sample Correlation (r) can be affected by extreme observations • Spearman’s Rank • 1st rank xi and yi then calculate sample correlation of these ranks • rs = 1- [6(d2)/n(n2-1)] • Where di = the differences of the ranked pairs
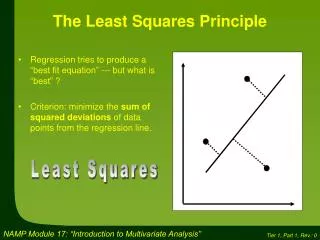
Linear Regression • Find/Define relationship between dependent variable and independent variable • Use independent variable to explain the behavior of the dependent variable • Separate variation in the data into explained variation and unexplained variation (noise) • Predict the value of the dependent variable given a value for the independent variable
Linear Regression Model • Predict Y given X • E(Y|X=x) = 0 + 1x • Y = 0 + 1xi + i • Assumptions: • I are random variables • E[i] = 0 • E[i i] = δ2 • E[i k] = 0 ik; they are uncorrelated
Sum of Squares • Total Sum of Squares = Regression sum of squares + Error sum of squares • SST = SSR + SSE • (yi -y)2 = (yi -y)2 + e2i
Coefficient of Determination (R2) • Measures how well x explain the variation in Y • R2 = SSR/SST = 1- SSE/SST = r2 • R2 measures the explained variation in the data
Confidence Interval • Error Variance: S2e = e2i/(n-2) = SSE/(n-2) • Unbiased Estimate of δ2b: S2b = S2e/(xi -x)2 • t = (b-)/Sb • C.I. for Regression Slope = b-tn-2,/2Sb < < b+tn-2,/2Sb
Regression Slope Tests • H0: = 0 or H0: 0 vs. H1: > 0 • Reject H0 if (b-)/Sb > tn-2, • H0: = 0 or H0: 0 vs. H1: < 0 • Reject H0 if (b-)/Sb < -tn-2, • H0: = 0 vs. H1: 0 • Reject H0 if (b-)/Sb > tn-2, or (b-)/Sb < -tn-2,
SAS: Inches-Centimeter • Data Height; • Input inches centimeter; • Datalines; • 1 2.54 • 2 5.08 • 24 60.96 • 4 10.16 • 5 12.7 • 16 40.64 • 7 17.78 • 8 20.32 • 19 48.26 • 10 25.4 • 20 50.8 • 25 63.5 • ; • ProcPlot Data=Height; • Plot inches*centimeter; • ProcCorr Data=Height; • Title 'Correlation Matrix of Inches vs. Centimeter'; • Var inches centimeter; • ProcReg Data=Height; • Title 'Regression Line for Inches-Centimeter Data'; • Model inches=centimeter; • Plot Predicted.*centimeter = 'P' • U95M.*centimeter = '-' L95M.*centimeter = '_' • inches*centimeter = '*' / overlay; • Plot Residual.*centimeter = 'o'; • Quit;
SAS: GRE – GPA Data • Data GRE_GPA; • Input GRE GPA; • Datalines; • 2100 4 • 1920 3.8 • 2290 3.8 • 1580 3.9 • 1400 3.77 • 1300 3.95 • 2020 3.8 • 1060 3.54 • 1500 3 • 1900 4 • 1900 3.7 • 1800 3.5 • 2200 4 • 1990 3.51 • 2000 4 • 1650 3.8 • 1640 3.75 • 1800 3.9 • 2300 3.91 • 2000 3.75 • 2000 3.9 • ; • ProcPlot Data=GRE_GPA; • Plot GRE*GPA; • ProcCorr Data=GRE_GPA; • Title 'Correlation Matrix of GRE vs. GPA'; • Var GRE GPA; • ProcReg Data=GRE_GPA; • Title 'Regression Line for GRE-GPA Data'; • Model GPA=GRE; • Plot Predicted.*GRE = 'P' • U95M.*GRE = '-' L95M.*GRE = '_' • GPA*GRE = '*' / overlay; • Plot Residual.*GRE = 'o'; • Quit;