Download
1 / 38
400 likes | 685 Vues
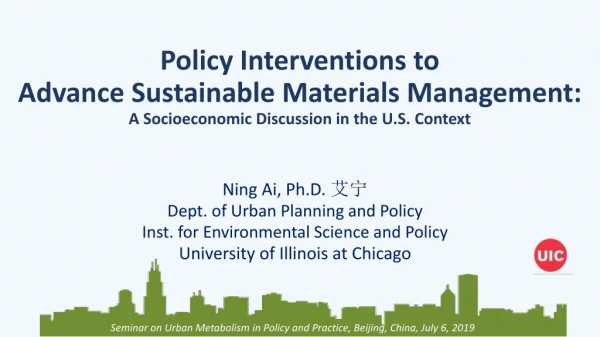
Policy Interventions to Advance Sustainable Materials Management: A Socioeconomic Discussion in the U.S. Context. Seminar o n Urban Metabolism in Policy and Practice, Beijing, China, July 6, 2019. Ning Ai, Ph.D. 艾宁 Dept. of Urban Planning and Policy

E N D
Policy Interventions toAdvance Sustainable Materials Management: A Socioeconomic Discussion in the U.S. Context Seminar on Urban Metabolism in Policy and Practice, Beijing, China, July 6, 2019 Ning Ai, Ph.D. 艾宁 Dept. of Urban Planning and Policy Inst. for Environmental Science and Policy University of Illinois at Chicago
Research Motivation 2 • Standalone processes of environmental and socioeconomic aspects of materials and waste management (MWM) • Challenges of financial viability and sustainability • Dilemma of social equity vs. economic efficiency • Lack of MWM data to support locally specific and efficient strategies
General Flows of Municipal Solid Waste (MSW) Ai, Ning. 2011. "Challenges of Sustainable Urban Planning: The Case of Municipal Solid Waste Management." Doctoral Dissertation, Georgia Tech.
Improve the MWM Efficiency by Strategic Infrastructure Planning Integrated Infrastructure Planning Consider MWM in New Development • Minimize Impacts of Existing Facilities • Monitor existing use and capacity • Expand MRF, C&D, and WTE capabilities • Explore new MWM methods and techniques • Recover methane from closed landfills • Avoid Unnecessary Expansion • Encourage source reduction and separation, recycling, reuse and composting • Incorporate reduction, diversion, and conversion in capacity projections • Require a county-wide review before siting new landfills • Mitigate Impacts of New Facilities • Preserve industrial lands • Only site new landfills in Candidate Solid Waste Landfill overlay • Design access routes to minimize traffic impacts • Screen landfills with vegetation • Plan for eventual restoration • Increase public awareness of solid waste issues Summary from Envision San José 2040: General Plan, Adopted November 1, 2011 Ai and Leigh (2017) Adapted from Daniels, 2014, p. 238.
Connecting MWM Planswith Other Regional Plans Source: Metro Vancouver (2010).
Environment • Compliance and progressive zero waste plans • Determine locally specific MWM methods • Plan across environmental media • Connections with other sustainability plans Infrastructure • Incorporate MWM considerations in new development reviews • Decouple waste volume from economic and population growth • Integrate material and waste management infrastructure • Plan for MWM infrastructure that integrates green design and environmental health impacts through life cycle stages of MWM Sustainable MWM Planning Strategies Finance • Budget planning for MWM services • Account for full costs when pricing for waste services • Dedicate MWM revenue to support recycling programs • Balance environmental and economic goals Economy • Job creation through reuse, recycling, and remanufacturing (R3) activities • R3 industry development • Planning and policy tools for economic development from waste diversion • R3 requirements for business and consumers Equity • Controversy surrounding waste facility siting • Market drivers and confounding factors that challenge equity goals • Stakeholder involvement, zoning ordinance, and assistance programs towards equity goals Technology • Data barriers to efficient and effective MWM • Plan for community-specific MWM using smart MWM technology • Employ planning tools that facilitate MWM data collection Ai and Leigh (2017)
Life Cycle Cost of MWM 9 • Full cost accounting/life cycle cost: 50-year span • Three-step analysis • Findings • Pro-landfilling activities incur the lowest short-term cost, but experience cost jump in the long run due to recurring and after-closure maintenance. • Short-term cost considerations discourage recycling. Ning Ai. “Implications of Sustainable Solid Waste Management for Metropolitan Planning.” The 50th ACSP Annual Conference, Crystal City, VA, October 1-4, 2009
MWM Approaches during Economic Recession 10 • Increase fees • Reduce services • Privatize services • Improve efficiency • Control waste flow • Promote recycling, reuse, and recovery Reduced MWM budget does not necessarily compromise environmental performance. Ai, Ning, and Anthony Grande. 2012. “Financially-Viable Approaches to Municipal Solid Waste Management during Economic Recession.” Young Professional Best Paper, 105th Annual Conference and Exhibition of the Air and Waste Management Association, San Antonio, Texas, June 19–22.
Market Based Instruments for MWM 11 Ai, N. and Leigh, N. L. (2017) Planning for Sustainable Material and Waste Management. American Planning Association (APA) Planning Advisory Service Report. Adapted from UNEP (2015), Box 4.17 and the IDB report by Cointreau and Hornig (2003). *Waste flow controls have been proposed by several regions but are currently prohibited by the federal law.
Economic and Market Approaches 12 • Extended product responsibility (EPR): Companies take back used items and manufacture more durable goods • Full cost accounting Pay as You Throw (PAYT) Recycling Reward Programs Source: http://www.go-green.ae/uploads/rewardsa.jpg Source: City of Portland.
Impact of Reduced Garbage Collection on Diversion 13 Images: City of Portland.
Urban Model for Surplus Food Recovery (West Philadelphia) ValueAddedApproach 14 (O’Donnell 2015)
Waste Management: Burden or Wealth 16 • “[New York] city’s waste was a fair exchange for the city’s cultural and economic contributions to national life” - Former Mayor Rudy Giuliani (quoted from Gandy, 2002) • “Landfills and communities can work together and accept each other and actually benefit from each other” - A former official of the Illinois Environmental Protection Agency (quoted by Parker, 2003) • “Garbage is good” (quoted by Parker, 2003) Interstate waste movement, 2003 (Repa 2005) Gandy, M. (2002).Concrete and Clay: Reworking Nature in New York City, Cambridge: MIT Press. Parker, B. (2003).White Paper: Solid Waste Landfills and Residential Property Values. National Solid Wastes Management Association (NSWMA).
Claimed Benefits of Waste Import 17 • Host community fees • Tax revenues • New job opportunities • Free or low-cost waste disposal quota • Portion of energy recovery • Infrastructure improvement Source: Parker, B. (2003). White Paper: Solid Waste Landfills and Residential Property Values. Online publication of National Solid Wastes Management Association (NSWMA). Picture source: http://www.abatement.com/images/airduct/profits.jpg
Planning Tool: Zoning Ordinance 18 Example zoning ordinance showing zoning districts in which MWM facilities are permitted (Sacramento County CA 2017)
Chicken or the Egg? 19 Valero Refinery: Manchester (Houston, Texas) More information available in the Fact Sheet by Texas Environmental Justice Advocacy Services. https://www.ucsusa.org/center-science-and-democracy/connecting-scientists-and-communities/air-toxics-and-health
Need of Community-Specific Data 21 Comparison of top-ten landfill-bound residential waste composition by income group Comparison of residential MSW composition Source: Illinois Recycling Association 2015, Fig 2-15 Data source Chicago Department of Environment 2010)
Planning Tools that Facilitate MWM Data Collection 22 • Web-based tools for MWM data analysis, information sharing, and policy development • Technology supported tracking systems (e.g., RFID) • City ordinances that incorporate recycling and data reporting • Market derived data (e.g. Pay as You Throw programs) • Stakeholder involvement
Case Illustration I:Chicago Food Waste Volume Estimates 23 Vwaste: Food waste generation (by weight); i: Generator type (i=1 Residential; i=2 Commercial; i=3 Institutional); j: Sub-categories of each generator type, such as SF and MF of residential generators (detail categories in Table 1); Ci: Number of sub-categories of generator type i; fij (): Food waste generation rate for sub-category j of generator type i; Nij: Number of units (e.g., employees or establishments) in sub-category j of category i; V1 , V2, …, Vm: causal factors of food waste generation; Ning Ai and Junjun Zheng (2019)
Chicago Food Waste Study: Connecting Local Supply and Demand 24 Ning Ai and Junjun Zheng (2019)
Transforming Urban Challenges into Opportunities: Close the Loop of Food Waste 25 Ning Ai. “Modeling Food Waste for Neighborhood-Based Sustainable Practice.” The International Society for Industrial Ecology Conference, Surrey, UK, July 7-10, 2015.
Case Illustration II: EV Batteries 26 • Short lifespan • Significant mass and volume • Substantial component of lithium • Difficulty in disassembly • Limited data availability • Specific infrastructure needs • Recycling/Disassembly • Remanufacturing • Repurposing (e.g. energy storage)
Key Parameters of EOL EV Battery Estimates 27 • Lifespans • Constant Lifespan Scenario: All EV batteries retire between 3 and 8 years with an average lifespan of 5.5 years. • Dynamic Lifespan Scenario: Technology advancements prolong the in-vehicle battery lifespans. The average life expectancy increases from 5.5 years (in 2010) to 9.5 years (in 2020), and to 12 years (in 2030). • Discard patterns • Uniform distribution of discard rates. • Truncated normal distribution function. • Weibull distribution function. Uniform Distribution and Normal Distribution Weibull Distribution Source: http://i.stack.imgur.com/ http://www.roymech.co.uk/Useful_Tables/ARM/Failure_Distributions.html
Case Illustration in California 29 • On an annual basis, 52% of new EVs in the U.S. were sold in CA • 33,200 PHEVs and 40,300 BEVs sold in 2016 (3.5% of new vehicle sales) • California Zero Emission Vehicles (ZEV) Plan: target a 15.4% market share of ZEVs of new car sales by 2024; 100% of market share by 2050 • Urgency of managing EOL EV batteries • Progressive adoption of renewable energy • Documented need for energy storage systems to ensure the reliability of the grid, to better utilize the existing renewable capacity, to reduce the consumption of fossil fuel, and to mitigate climate change impacts.
Annual EV Sales by County 30 • Ning Ai, Junjun Zheng, and Weiqiang Chen (2019)
Accumulative EOL EV Batteries vs. Potential Uses in California 31 Ning Ai, Junjun Zheng, and Weiqiang Chen (2019)
Policy Discussions 33 • Sustainable policies need to be economically viable and sustainable. • Redistribution of costs and benefits necessitates careful examination. • Implementing local solutions would necessitate proactive facility planning and region-wide coordinated efforts. • Top-down and bottom-up approaches are both needed; education and innovation are critical.
Where is the Garbage Can? 34 Parka Food Co. https://www.thestar.com/life/2018/05/15/toronto-restaurant-takes-coffee-cup-recycling-into-their-own-hands.html
THANK YOU Ning Ai 艾宁 • 美国伊利诺伊大学芝加哥分校 ain@uic.edu
A Metabolic View of Urban Sustainability 36 Stressors Inputs Outputs Close the Loop Energy Air Emission Population Growth Water Solid Waste Land Development Food Waste Water Decreasing Life Span of Products Goods Waste Heat Increasing Intensity of Material Use An urban system cannot be sustainable if it requires more resources than it can produce on its own and generates more wastes than the environment can assimilate.
Challenges of Policy Making 37 • Local Efforts vs. Global Impacts • Efficiency vs. Equity • Short-Term vs. Long-Term Impacts • Limited Local Data vs. Regional Heterogeneity • Impacts across environmental media, geographical boundaries, and academic and professional disciplines Ning Ai and Nancey Green Leigh. “Planning for Sustainable Material and Waste Management.” American Planning Association Planning Advisory Service (PAS) Report #587. May 2017.
Drivers of Material & Waste Management (MWM) Environmental protection Local environmental – treatment and disposal 4 Global Environmental – climate change Public health Public health - collection Waste disposal capacity Waste export & landfill diversion Resource value of the waste Rediscover recycling Resource scarcity management Social equity Facility siting- waste infrastructure Job creation – recycling, reuse & remanufacturing Green jobs 2020 1960 1970 1980 1990 2000 2010 Ning Ai and Nancey Green Leigh. “Planning for Sustainable Material and Waste Management.” American Planning Association Planning Advisory Service (PAS) Report #587. May 2017.