Download
1 / 35
350 likes | 488 Vues
Placing Transportation in Urban Metabolism. Stephanie Pincetl , PhD University of California, Davis - April 5, 2013. A COLLABORATION AMONG:. Overview of our research: Establishing the Urban Metabolism of Los Angeles County. CEC PIER funded research .

E N D
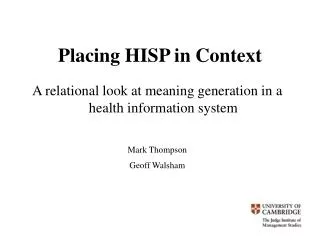
Placing Transportation in Urban Metabolism Stephanie Pincetl, PhD University of California, Davis - April 5, 2013 A COLLABORATION AMONG:
Overview of our research: Establishing the Urban Metabolism of Los Angeles County. CEC PIER funded research • Cities are complex systems of flows directed by human decisions within institutional contexts such as planning and administration • Urban metabolism is a way to describe the flows that sustain cities • Our research updates traditional urban metabolism and pilots a novel combination of data and methods in Los Angeles County including: • Economic flows • Ground up data for the first time in a UM analysis • Transportation analysis is a big component of the flows and we introduce transportation LCA to UM • Embedded energy in urban fabric indicators
Project Research Partners Paul Bunje* Senior Director Prize Development, Ocean Health X Prize Foundation Stephanie Pincetl, Ph.D. Director California Center for Sustainable Communities Institute of the Environment & Sustainability University of California, Los Angeles Dan Flaming President Economic Roundtable Mikhail Chester, Ph.D. Director Assistant Professor Civil, Environmental, and Sustainability Engineering Affiliate Faculty, School of Sustainability Arizona State University Zoe Elizabeth Program Manager California Center for Sustainable Communities Institute of the Environment & Sustainability University of California, Los Angeles Mike McCoy* Executive Director Strategic Growth Council State of California Patrick Burns Senior Researcher Economic Roundtable Giovanni Circella, Ph.D. Post Doctoral Researcher Urban Land Use and Transportation Center (ULTRANS) Institute of Transportation Studies University of California, Davis Funding by the California Energy Commission’s PIER Program * denotes former researcher partners
Urban Metabolism (UM) • An Urban Metabolism approach builds a picture of the complex urban system and its energy underpinnings – the inputs that support the system, and the waste produced.With this understanding, urban sustainability policies, programs and practices can emerge.
Urban Metabolism for LA and Beyond • We are capturing embedded energy and emergent energy use and the creation of new path dependencies • For example: energy impacts of alternative transportation modes and land use • We should be in a position to show how infrastructure design leads to emergent behaviors across a city, and sets path dependencies.
Urban Metabolism 2.0 • UM to date has been at a high level, using aggregated data. • To get to greater sustainability UM needs disaggregated, granular data about what is going on in the system: who is using what where, to do what, and producing what wastes. • It also needs to take into consideration the embedded energy already there in the urban fabric. • Equity impacts and public health are results of UM that need consideration too.
Data Sources Including Granular Data • Use of IMPLAN data (PECAS), and Carnegie-Mellon EIO/LCA data adjusted for California • Life Cycle cradle-to-grave for certain infrastructures (buildings and transportation) • Some social and environmental health impacts employment sectors and transportation mode trade-offs • Equity impacts will be evaluated – who uses how much of what where
Our Aims • Theoretical – improve UM as a way to quantify and understand what is the material basis of urban systems and their complexity. • Practical – to provide data and analysis to policy makers, agencies and others to enable them to target investments in energy/water, efficiency & conservation; for climate mitigation, adaptation and resilience. And to ensure equity and health considerations of different choices are understood.
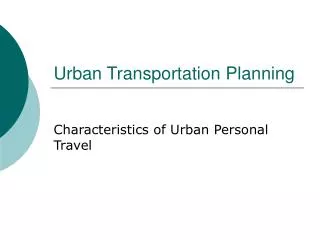
Transportation Analysis in our Project – Mike Chester, ASU • Understand the part that transportation plays in LA’s urban metabolism beyond VMTs and GHGs. • Chester et al have been applying Life Cycle Analysis to several of the important transportation sectors of the city. • Comparing the full Life cycle of bus rapid transit, light rail and the passenger car with 1 person (SOV). • Also evaluating the embedded energy in the County’s roadways and parkades.
Los Angeles MetroOrange & Gold Lines Energy and Life Cycle Assessment San Fernando Valley SEDAN ORANGE Pasadena GOLD Encino Station Canoga Park Station
The Transportation “System” Extraction of Raw Materials Manufacturing Operation / Maintenance End-of-life Extraction of Raw Materials Construction Decommissioning Operation / Maintenance Raw Fuel Extraction Transport Processing / Refining Electricity Generation Distribution Background image source: American Institute of Architects, 1997 Environmental Resource Guides
Environmental Indicators • Energy • Air Emissions • SO2 Respiratory irritant, acid deposition • CO Asphyxiant • NOX Respiratory irritant, smog • VOC Photochemical smog, cancerous • PM Respiratory and cardiovascular damage • Greenhouse Gases • CO2, CH4, N2O
Results for Transportation Modes • There is not one optimal solution • BRT and light rail both produce less criteria pollutants and GHGs than SOV when the full life cycle is taken in to account (even at present ridership levels), even with the prospect of much more efficient automobiles due to new CAFE standards.
Preliminary Results Particulate Matter Inventories PM Emissions in mg per Passenger Mile Traveled Life cycle PM2.5 emissions are dominated by: 1) Steel and aluminum production furnace emissions for vehicle manufacturing. 2) Supply chain diesel truck use. Life cycle PM10 emissions are dominated by: 1) Asphalt aggregate production for sedan and Orange line infrastructure. 2) Steel, iron, and aluminum for vehicle manufacturing.
Preliminary Results Ozone Precursor Inventories Emissions in mg per Passenger Mile Traveled Life cycle VOC emissions are dominated by: 1) Vehicle fluids (steering, brake, transmission, coolants, etc.). 2) Vehicle manufacturing and truck transport. 3) Volatile organic diluents in asphalt. Life cycle NOX emissions are dominated by: 1) Orange line tailpipe @ 19 grams/VMT Range: 8.2 to 73 grams/VMT. 2) Supply chain diesel truck use.
Preliminary Results SO2Inventory Emissions in mg per Passenger Mile Traveled Life cycle SO2 emissions are dominated by: Direct and supply chain electricity use Gold line uses LADWP (39% coal).
Transportation and UM Implications • Transportation is a part of the larger urban metabolism. • It requires infrastructure that has not only present costs, but life cycle costs and it embodies huge energy and materials investments. • Transportation systems are often creators of path dependencies and are then created by those same path dependencies. • True costs are rarely evaluated. UM can start doing so.
Next Steps For Transportation Analysis • Add embedded energy in all the roadways and parkcades of the County. • Look at land use and transportation alternatives • Future TOD sites • Embedded energy in construction types and alternatives • Gentrification potential in different TOD types and locations
UCLA Emphasis: Bottom Up Data • Mapping Flows • Electricity Water and Gas at customer billing level by customer class and billing cycle (LADWP) • Solid waste flows for Los Angeles City and County • Analyzing use patterns by: • Sociodemographic characteristics (census) • County parcel assessor data • Land use type (zoning) • Building shell and age • Climate zones
Energy and Water Mapping • Data from directly from Los Angeles Department of Water and Power. • Obtained Southern California Edison and the Gas Company data but only by an NDA with the PUC.
Energy Analysis • DWP interested in climate impacts on energy use • Potentially in targeting investments in conservation, efficiency and distributed generation relative to climate impacts • Interested in rates and income generally and seasonally given tiered pricing and warm season pricing • Targeting messages to different ethnic communities • Understanding energy use by different economic sectors
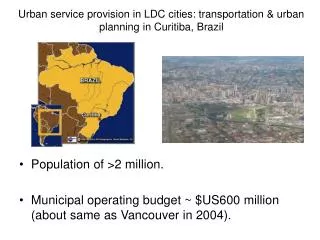
Water Analysis • Collaboration with Terri Hogue, Colorado School of Mines and Diane Pataki University of Utah • How much water is used for outdoor irrigation in the city of Los Angeles? • DWP interested for rates and for conservation – sociodemographic profiles and water use. • We will add County Assessor parcel information. • We are using satellite imagery of NDVI coupled with ground up water use to estimate water use in the different parts of the city. • Existing outdoor irrigation models are contradictory and there is no good, as yet, way to estimate. We are contributing to this attempt.
Residential Water Consumption Patterns • Average Single-FamilyResidential (SFR) per Census tract for 2000-2010 Averageper Census tract= 387 gal/SFR customer/day • Data provided by Los Angeles Department of Water & Power • Terri Hogue Colorado School of Mines
Water Use • Unlike energy, water is distributed by over 100 different entities in the county. LADWP is the biggest entity, but there are lots of others. • Some success in getting data from the other MOUs. • Analysis will include how much can be conserved without harming major vegetation like trees. • Analysis will also address water/energy nexus.
Waste Flows • Statewide jurisdictions only report a single value to the state. LA has a little more data. • “Commercial” includes large multi-family properties in addition to non-residential properties, blurring the category. • Real volumes are unknown from either commercial or residential sectors. • No way to know, across the landscape, who is generating what kind or amounts of waste. • Waste has unquantified embedded energy and resources.
Urban Metabolism is a result of complex urban systems that are: • Accretionary • Opportunistic • Political • Obdurate • Interdependent and path dependent • Fossil energy underlies modern urban systems and must be better accounted for and understood.
Our Research • Preliminary • Difficult & complex • Different methods and scales • Perhaps too ambitious • Embedded energy • Energy flows • Use of energy • Energy impacts • Transportation is an important component and driver and of keen interest by the state given GHGs. But we see it as both an artifact of the system and a driver of patterns.
Contact Us Dr. Stephanie Pincetl:spincetl@ioes.ucla.edu California Center for Sustainable Communities at UCLA Institute of the Environment and Sustainability Website:californiasustainablecommunities.com Email: info@californiasustainablecommunities.com Phone: (310) 825-3778