Download
1 / 60
620 likes | 729 Vues
Power Sector in Thailand: from Problematic Planning and Governance to Feed-in Tariffs. Chris Greacen Palang Thai Helvetas seminar Power Sector Governance in the Mekong Region: Challenges and Opportunities in Thailand and implications for Laos 1 March 2011 Vientienne, Laos.

E N D
Power Sector in Thailand: from Problematic Planning and Governance to Feed-in Tariffs Chris Greacen Palang Thai Helvetas seminar Power Sector Governance in the Mekong Region: Challenges and Opportunities in Thailand and implications for Laos 1 March 2011 Vientienne, Laos
In Thailand the dominant narrative concerning Lao hydropower goes more or less like this… MW 48,958 MW “Thailand’s electricity demand is projected to increase over 34,000 MW (2.5 times) by 2030”. 2,477 2,399 2,287 37,382 MW 2,235 2,178 2,131 2,035 27,996 MW 1,832 Demand increase per year 1,759 1,629 1,361 1,410 1,268 1,444 1,449 “Thai demand for electricity will rise a lot” “Thailand needs to diversify its fuel sources from natural gas” “Thai people don't want any more dams” “Lao people will benefit from sale of hydro-electricity to Thailand” “Therefore, Laos should build dams and Thailand should buy from dams in Laos.” 2550 – 2554 average increase 1,386 MW 2555 – 2559 average increase 1,877MW 2560 – 2564 average increase 2,315MW แผนพัฒนาฯ ฉบับที่ 10 แผนพัฒนาฯ ฉบับที่ 11 แผนพัฒนาฯ ฉบับที่ 12 ที่มา กฟผ.
Outline • Where Thailand’s electricity comes from • Structure of Thai power sector • Centralization and its problems • Governance issues in Thai power sector • Thai electricity consumption patterns • Planning • Load forecast • Power Development Plan (PDP), • Over-investment • Decentralized generation alternatives • Renewable energy • Target • Very Small Power Producer (VSPP) regulations • Some Thai clean community energy examples
Import & Others, 3% Hydro,6% Coal & Lignite, 21% Oil,0.1% Natural Gas, 70% Power generation (May 2009) Generation by fuel type Generation by sources IPP 12,151 MW (43%) EGAT,13,615 MW (48%) SPP 2,073 MW (7%) Import & Exchange 640 MW (2%) Total: 28,482 MW ที่มา: EPPO Aug 2009
Power Purchase from Neighboring Countries • Thailand has cooperated in hydropower development with neighboring countries, on a bilateral basis. • MOUs on power purchase have been signed with Laos, China and Myanmar, with a total power purchase of 11,500 MW. • Imported power being supplied to Thailand’s Grid: • LPDR 313 MW • Malaysia 300MW[High Voltage Direct Current (HVDC)] ที่มา: EPPO Aug 2009
Power Purchase from LPDR Status as at Jun09. ที่มา: EPPO Aug 2009
Govt. ERC Structure of Thai power sector Generation (% share) EGAT (50%) IPPs (41%) Import (2%) VSPPs (<<1%) SPPs (7%) EGAT (100%) Transmission PEA (67%) MEA (31%) Direct Customers (2%) Distribution Users Users Remarks: - Figure of % Share in 2008 - ERC = Energy Regulatory Commission ที่มา: EPPO Aug 2009
Centralized decision-making Centralized Power & Large power plant Money Flow Electricity flow Customers
(all of the) supply options considered in the PDP by EGAT 700 MW Coal-fired power plant 700 MW gas-fired combined cycle plant 230 MW gas-fired open cycle plant 1,000 MW nuclear plant Hydro imports are politically negotiated outside of PDP process DSM/EE, RE, Distributed generation not considered as supply options
Problems with Centralized Power • (more costly) • Separation of consumption and production leads to inefficient consumption • “Out of sight, out of mind” • Loss of livelihood/health/forests for local people for the benefits of others, mainly urban commercial and industrial interests • Generate at large power plants hundreds of km from commerce and industry that uses power
Problems with centralized decision-making • Lack of accountability, transparency, participation in centralized planning processes • Political decisions masked in technical language • Social and environmental concerns are ignored • “Cost plus” incentive structure • passes risks to consumers • “Overcapacity worth 400 billion Baht” (from total assets of 700 billion Baht and annual turnover of 240 billion Baht) – Prime Minister ThaksinShinwatra
Conflict of interest : policyv business Board of directors Permanent secretary of ministry of energy Chairman of PTT Chairman of EGAT Board member of PTT chemical Chairman of Rayong refinery Director general,Energy fuel Dep. permanent secretary Board member of Thai oil Board member of RATCH Dep. permanent secretary Board member of PTTEP Dep. permanent secretary Director general of energy business Board member of PTT Director general of Department of Alternative Energy Development and Efficiency energy Board member of RATCH Director of Energy Policy and Planning official Board member of PTTEP Senior official of ministry of energy Board member of Aromatics PLC Senior official of ministry of energy Board member of Bang chak Board member of RATCH Board member of Ratchaburi generation company Senior official of ministry of energy
Performance of high-level energy officials in serving the government vs. PTT Plc. (Thai gas/oil utility, the largest list company in Thailand) 67% 100% 90% 83% *จากรายงานประจำปีบมจ. ปตท. ปี 2546 **ตั้งแต่มีการปรับองค์ประกอบคณะอนุกรรมการ Ft โดยแต่งตั้งให้นายเชิดพงษ์เป็นประธาน และนายเมตตาเป็นรองประธาน (ปลายปี 46) Government officials serve energy companies better than the Thai public?
Electrical consumption by sector in 2007 Others 5% Residential21% Industrial49% Commercial 25% การใช้พลังงานไฟฟ้าแยกตามประเภทผู้ใช้ 133,132 GWh ที่มา กฟผ.
การกระจายตัวของการใช้ไฟฟ้าแยกตามพื้นที่Distribution of electricity consumption by region South North Northeast Central Source: Figure 19, Statistical Report Fiscal Year 2003 Power Forecast and Statistics Analysis Department System Control and Operation Division. Report No. SOD-FSSR-0404-05
Comparison of electricity consumption of three big malls vs. 16 provinces Siam Paragon GWh 123 MBK 81 278 GWh Central World 75 ที่มา: พพ. รายงานการใช้ไฟฟ้า ปี 2549 ที่มา: การไฟฟ้านครหลวง 2549
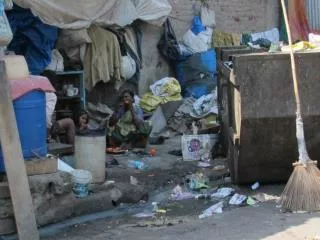
Siam Paragon 1700 families relocated 123 Loss of livelihood for >6200 families MBK 81 Loss of 116 fish species (44%) Central World Mae Hong Song Fishery yield down 80% 75 65 Electricity production and consumption (GWh) Impacts of Pak Mun Dam alone Source: MEA, EGAT, Searin, Graphic: Green World Foundation Pak Mun Dams Malls Province
การกระจายของจำนวนผู้ใช้ไฟและปริมาณการใช้ไฟฟ้าDistribution of number of power users & energy consumed Agricultural pumping Government Specific businesses Large industrial/commercial) Small industrial/commercial Small industrial/commercial Large houses (>150 kWh/mo) Small houses (<150 kWh/mo) Number of customers Electricity consumption ที่มา : รายงานการปรับโครงสร้างอัตราค่าไฟฟ้า (มติ ค.ร.ม. วันที่ 3 ตุลาคม 2543)
"Nature has enough for our need, but not enough for our greed." - Gandhi
Thai load duration curve (2002) > 1,000 MW in 66 hours
Load profile on the day of annual highest consumption Notice the rise of air-conditioning load 2551 2550 2549 2548 พลังไฟฟ้า (เมกะวัตต์) 2534 2533 2532 เวลา (ชั่วโมง)
Thai power sector planning:Demand Forecast,Power Development Plan (PDP), Over-investment
Power demand projectionSep 2007(PDP 2007revision 1) MW 48,958 MW 2,477 2,399 2,287 37,382 MW 2,235 2,178 2,131 2,035 27,996 MW 1,832 Demand increase per year 1,759 1,629 1,361 1,410 1,268 1,444 1,449 2550 – 2554 average increase 1,386 MW 2555 – 2559 average increase 1,877MW 2560 – 2564 average increase 2,315MW แผนพัฒนาฯ ฉบับที่ 10 แผนพัฒนาฯ ฉบับที่ 11 แผนพัฒนาฯ ฉบับที่ 12 ที่มา กฟผ.
Planning of capacity additions (Total capacity requirement = peak demand + 15% reserve margin)
Power Demand: Projections vs. Actual1992 – 2008If no systemic bias, the chance of over-projecting demand 12 times in a row should be 1/4096!! MW
Incentive structure for utilities:the more expansion, the more profits • Financial criteria for utilities link profits to investments • Thailand uses outdated return-based regulation • ROIC (Return on Invested Capital means: the more you invest, the more (absolute) profits you get 4.8% Result: Demand forecast have systemic bias toward over-projections Too many expensive power projects get built
Cycle of over-expansion under the centralized monopoly system Deterministic planning based on demand forecast leads to over-investment in capital-intensive power projects Power demand (over-)projections 1 2 Utilities’ Profits 3 Tariff structure that allows pass-through of unnecessary investments
Comparison of trend lines with historical peak consumption Exponential Linear Past demand trajectory was linear but how come the official demand projections have always assumed exponential trend and over-estimated?
The government forecast was based on the assumption of exponential growth 21power plants
หมายเหตุ 1. ใช้สมมติฐานว่าต้นทุนร้อยละ 12.4 ของค่าไฟฟ้ามาจากธุรกิจสายส่ง 2. ใช้สมมติฐานว่าต้นทุนร้อยละ 14.5 ของค่าไฟฟ้ามาจากธุรกิจจำหน่าย 3. ค่า CO2 ที่ 10 ยูโร/ตัน 4. ค่า Externality ตามการศึกษา Extern E ของสหภาพยุโรป และนำมาปรับลดตามค่า GDP ต่อหัวของไทย 5. 5. The World Bank, Impact of Energy Conservation, DSM and Renewable Energy Generation on EGAT’s PDP, 2005. 6. ตามระเบียบ SPP 7. ที่มา : กฟผ. 8. California Public Utilities Commission (CPUC), 2050 Multi-Sector CO2 Emissions Abatement Analysis Calculator, 2009 9. Cost of liability protection, Journal “Regulation” 2002 – 2003.
Office of the National Economic and Social Development Board O F F I C E O F T H E P R I M E M I N I S T E R Macroeconomic Analysis Low Quality Education Low Quality labour Enabling factors: MACROECONOMIC MANAGEMENT (Low margin/return) Low Quality for Raw-material, machinery and equipment Insufficient inR&D Investment No immunity/ High volatility Financial System Lack of Saving Lack of regulation on industrial product’s quality control Low Basic infrastructure and Logistic development Slow Technology Development
Decentralized generation • Decentralized generation: generation of electricity near where it is used
Old way New way Power plant Power plant Biomass Wind power Biomass Solar Customers Energy efficient end-use
Centralized energy is more costly Decentralized generation brings down costs Ireland – retail costs for new capacity to 2021 Thailand PDP 2007 requires 2 trillion baht to implement, comprising: million B • generation 1,482,000 • transmission 595,000 Transmission adds 40% to generation costs Source: World Alliance for Decentralized Energy, April 2005
Technical regulations: Allowable voltage, frequency, THD variations Protective relays 1-line diagrams for all cases: Induction Synchronous Inverters Single/multiple Connecting at different voltage levels (LV or MV) Communication channels Commercial regulations: Definitions of renewable energy, and efficient cogeneration Cost allocation Principle of standardized tariff determination Invoicing and payment arrangements Arbitration $
Evolution of Thai VSPP regulations • 2002 • VSPP regulations drafted, approved by Cabinet • Up to 1 MW export, renewables only • Tariffs set at avoided cost (bulk supply tariff + FT) • 2006 • Up to 10 MW export, renewables + cogeneration • Feed-in tariff “adder” • If > 1 MW then utility only pays for 98% of energy • 2009 • Tariff adder increase, more for projects that offset diesel http://www.eppo.go.th/power/vspp-eng/ for English version of regulations, and model PPA
Thai VSPP feed-in tariffs Assumes exchange rate 1 Thai baht = 0.029762 U.S. dollars Tariff = adder(s) + bulk supply tariff + FT charge Biomass tariff = $0.009 + $0.049 + $0.027 = $0.085/kWh
July 2010 PPAs signed for additional 4283 MW 847 MW online Thailand VSPP Status