
Distracted Driver Activity
E N D
Presentation Transcript
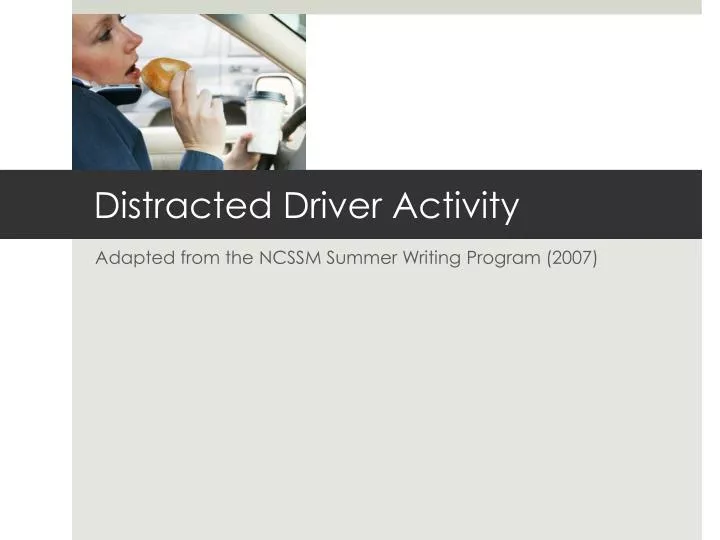
Distracted Driver Activity Adapted from the NCSSM Summer Writing Program (2007)
Research Question: • Are drivers more distracted when using a cell phone than when talking to a passenger in the car?
Directions: • Organize into groups of 3 or 4 and discuss the table presented on the frot side of this packet. Generate as many conclusions as you can from this data and prepare to share this information with the class
This Activity’s Goal... • The purpose of this activity is to give you a head start on the thinking and concepts you will encounter this year. • We will explore the basic ideas of: • Exploring Data - uncovering and summarizing patterns. • Making Inferences - deciding whether or not an observation could be due to chance.
Vocabulary Variable – any characteristic of an individual, object or group. • Categorical – places an individual into one of several groups or categories. • Quantitaive – takes numerical values for which arithmetic operations make sense.
Vocabulary Statistics – the science (and art) of learning from data
Data Summary: Two-way Table Isn’t this table easier to work with?
Vocabulary Distribution – tells us what type of values a variable takes on and how often this occurs. Distributions may be expressed as tables or graphs.
Numerical summaries: Is this information strong enough to justify that there is a difference between cell phones as a distraction and passengers as a distraction? Or could this outcome be due to random variation (which treatment the drivers were placed in)?
Simulation We must start by assuming that the driver will perform the same whether they are talking on a cell phone or to a passenger. In your groups, decide how to use the deck of cards to carry out randomized simulations of this experiment.