Ambient CO 2
Soil Sample. Thermomicrobia. Various Genera Incertae Sedis. Uncharacterized. Culture-dependent approach. Culture-independent approach. Uncharacterized. Sphingobacteria. DNA/RNA extraction. Cell extraction. Actinobacterium. PCR amplification/ RT-PCR. Community Fingerprints. Cloning.

Ambient CO 2
E N D
Presentation Transcript
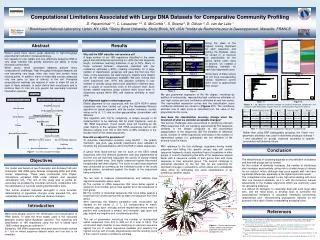
Soil Sample Thermomicrobia Various Genera Incertae Sedis Uncharacterized Culture-dependent approach Culture-independent approach Uncharacterized Sphingobacteria DNA/RNA extraction Cell extraction Actinobacterium PCR amplification/ RT-PCR Community Fingerprints Cloning Serial dilutions Verrucomicrobiae T/DGGE, ARDRA, T-RFLP, SSCP, RISA, Microarray Reamplification Plating Sequencing Uncharacterized Bioinformatics β-Proteobacteria Ambient CO2 Elevated CO2 Elevated CO2 Ambient CO2 Bacterial/Fungal isolates γ-Proteobacteria Sequence Assembly δ-Proteobacteria RDP/Blast Classifier Analysis Pair wise/multiple alignment Clustering α-Proteobacteria Uncharacterized Figure 2 Figure 3 Species Identification Phylogenetic analysis Acidobacterium Figure 5 Figure 4 Figure 9 Figure 10 Figure 6 Figure 7 Figure 12 Figure 11 Computational Limitations Associated with Large DNA Datasets for Comparative Community Profiling D. Papamichail 1,2, C. Lesaulnier 1,3, S. McCorkle 1, S. Skiena 2, B. Ollivier 3, D. van der Lelie 1 1Brookhaven National Laboratory, Upton, NY, USA. 2Stony Brook University, Stony Brook, NY, USA. 3Institut de Recherche pour le Developpement, Marseille, FRANCE. Results Abstract Using the value of the highest scoring alignment for each sequence, and setting the Boolean value for correct (1) or incorrect (0) classification for the genus, family, order, class or phylum, we created a confidence estimate for each blast alignment score. Since many of these scores do not have corresponding ratings, regression curves were used to approximate their values. Recent years have shown great advances in high-throughput experimental methods in molecular biology. Our capacity to now rapidly and cost effectively sequence DNA in very large volumes has greatly advanced our ability to study microbial communities. While useful, these generated datasets present many computational challenges. High-throughput biological datasets are now becoming very large, often very noisy and contain many missing points. In addition, many of these data sources measures only one gene (or type of activity) in the cell. Principled computational methods are required in order to make full use of each of these datasets, to better define their constituents and to combine them to infer not only genetic but eventually functional interaction networks. Why did the RDP classifier not convince us? A large number of our 16S sequences classified in the same genus had edit distances accounting for >20% the total sequence length, sometimes reaching distances of up to 50%. Many of these occurred between sequences classified with low confidence estimates (<50%), creating uncertainty for a large number of classification groupings and gave the first clue that many of the sequences we were trying to classify were distant from all the vetted sequences available. We also noticed that some sequences with >97% edit distance similarity to any member of another group were found classified in different taxa, with a couple of occurrences even in the phylum level. Such closely related sequence group schisms were found even in sequences groups within 99% edit distance similarity to each other. We use polynomial regression of the 4th degree, smoothed by addition of extra points, representing high confidence estimates at very high scores and zero confidence estimates at very low scores. The unsmoothed regression curves and the classification score confidence estimates are shown in (Figures 2-7). The confidence estimate now of each score is calculated from the value of the polynomial for this score. Full Alignment against vetted sequences. Global alignment of our sequences with the 5574 RDP-II vetted sequences was then carried out using the Needleman-Wunsch algorithm for global alignment, with the (match, mismatch, ins/del) values set to (0, 1, 1) and no other gap penalties (Levenshtein edit distance). This algorithm with O(n^2) complexity, is simple enough in its implementation to be relatively fast for small fragments, such as 16S rRNA sequences. These results were still troubling as the great majority of the sampled 16S rRNA sequences had an edit distance ranging from 150 to 300 (90% to 80% similarity) to the closest match in the vetted sequences. Figures 9 – 12 represent alternate methods for profiling community composition and change for both Prokaryotes (Figures 9 and 11) and Eukaryotes (Figures 10 and 12). How does the classification accuracy change when the threshold of what we consider acceptable changes? Two serious challenges were encountered in identifying unknown rRNA sequences from our sampling experiment (i) The sequence similarity is not always congruent to the taxonomical categorization of the sequences. (ii) The limitation of reference points (number of vetted sequences) and biases in the number of represented groups (i.e. pathogens) are not reflective of the diversity found in nature. With reference to the first challenge, organisms having similar properties and falling into specific groups may still contain sequence fragments closely resemble those of organisms in other groups. It is worth mentioning that 62% of the sequences aligned better with a sequence outside of their genus than with some sequence in their assigned genus. The second challenge is somewhat alleviated by the fact that we are searching for significant changes in populations, which allows us to extrapolate ratios either by eliminating low score classifications or by combining classifier results. Table 1 – Statistical analysis of population importance and distribution Rather than using RDP phylogenetic grouping, the Chao1 non-parametric estimator was used to determine phylotype richness 4, 5 and calculated on groups clustered according to specific Levenshtein edit distance values. How did we adjust the parameters? To maximize classification accuracy using BLAST 3, the (match, mismatch, gap_start, gap_extend) parameters were adjusted to minimize the misclassifications within the RDP-II vetted sequences. A genus level leave-one-out test for each of the 5574 vetted sequences with nine different parameter sets was implemented to find the one set that best separates the scores of closely related species to distant ones. Only highly conserved regions that match exceptionally well were aligned. The score for each blast alignment was constructed by summing up the individual scores of the locally aligned pieces, normalized against the length of the sequences being compared. The two tests to measure misclassifications and calibrate local alignment parameter space, were: (i) The number of rRNA sequences that score better against a sequence from another genus than against all of the sequences in their genus. (ii) The number of ribosomal sequences that score better against a sequence from another genus than at least one sequence from their genus. After examining the different parameter sets constructed, we decided on the values (1, 5, 3, 2.5 corresponding to match, mismatch, gap_open, and gap_extend respectively) where match is positive and considered a reward, and mismatch, gap_open and gap_extend are negative and considered penalties. This set of parameters minimized the number of misclassified vetted sequences from 274 to 229 out of a total of 5574. The constructed blast classifier is now classifying an unknown sequence against the set of vetted sequences available and selecting the highest scoring sum of locally aligned pieces and the resulting score is then used to create a confidence estimate. Conclusion Figure 1 – Currently available technology Objectives The effectiveness of clustering depends on the definition of distance and how well groups can be formed. As the number of elements increases, the number of clusterings also increases exponentially, giving rise to a wide range of choices for our solution, which, although may score equally well, can have significant differences, especially at the higher taxonomic levels. The computation time needed is very high when dealing with more than one thousand elements, as it is with the numerous manual adjustments to the multiple alignments which are commonly used for calculating distances. It is difficult for biologists to classically deal with such large data sets, and the need exists to develop tools to overcome the computational limitations in accurately identifying taxonomical relationships and reconstructing phylogenetic histories for the purpose in this case of better extrapolating ecological roles. Our model was based on two Prokaryotic and Archaeal 16S and Eukaryotic 18S rRNA gene libraries comprising 6000 and 2000 clones respectively. These were constructed from Poplar rhizosphere extracted DNA under ambient and elevated atmospheric CO2. The aim of this study was to profile as accurately as possible the microbial community composition with the optimization of currently existing bioinformatics tools. This further enabled molecular ecologists a more accurate determination of population changes under elevated CO2 and extrapolate the reasons for which we observe changes. Introduction References Many tools already exist for the identification and classification of rRNA genes. To date the most widely used is the ribosomal database project Naïve Bayesian classifier. The clustering and classification of 16S sequences using this tool is based upon ~5600 vetted sequences outlined in 1. Eukaryotic 18S rRNA sequences have been taxonomically outlined in 2, but no vetted sequence dataset exists and one had to be compiled. 1 Garrity, G., Bell, J. A., and Lilburn, T. G. 2004. Taxonomic outline of the prokaryotic genera. Bergey's manual of systematic bacteriology, 2nd ed., release 5.0. Springer-Verlag, New York, N.Y. [Online.] DOI: 10.1007/bergeysoutline200405 http://141.150.157.80/bergeysoutline/. 2 Kirk, P. M., Cannon, P. F., David, J. C., and Stalpers, J. A. 2001. Ainsworth and Bisby's dictionary of the fungi, 9th ed. CAB International, Wallingford, United Kingdom. [Online at http://www.speciesfungorum.org/Names/fundic.asp.] 3 Altschul, S. F., Madden, T. L. et al (1997). "Gapped BLAST and PSI-BLAST: a new generation of protein database search programs." Nucleic Acids Res 25(17): 3389-402. 4 Chao, A. 1984. Nonparametric estimation of the number of classes in a population. Scandinavian Journal of Statistics, 11, 265-270. 5 Chao, A. 1987. Estimating the population size for capture-recapture data with unequal catchability. Biometrics, 43, 783-791. Figure 8 – Classic representation of both ambient and elevated population constituents with phylogenetic tree.