Understanding Holt's Exponential Smoothing with Trend Adjustment for Forecasting
This guide explores Holt's Exponential Smoothing method for forecasting data with trend adjustments. It discusses the components of the formula: the exponentially smoothed forecast (Ft), the smoothed trend estimate (Tt), and the role of the smoothing constants (α and β). The chapter includes a practical example of calculating forecasts and emphasizes the significance of incorporating seasonality into predictions for enhanced accuracy. Additionally, it covers the calculation of forecast errors, such as Mean Absolute Deviation (MAD) and Mean Absolute Percentage Error (MAPE).

Understanding Holt's Exponential Smoothing with Trend Adjustment for Forecasting
E N D
Presentation Transcript
Exponential Smoothing with Trend Adjustment (Holt) Forecast including trend (FITt) = exponentially smoothed forecast (Ft) + exponentially smoothed trend (Tt)
Exponential Smoothing with Trend Adjustment (Holt) Ft = Forecast with Trend last period + (Last period’s actual – last period’s Forecast with Trend or Ft = FITt-1 + a (At-1 –FITt-1) Tt = Trend estimate last period + (Forecast this period - Forecast with Trend last period) or Tt = Tt-1 + (Ft - FITt-1)
Exponential Smoothing with Trend Adjustment (Holt) • Ft = exponentially smoothed forecast of the data series in period t • Tt = exponentially smoothed trend in period t • At = actual demand in period t • = smoothing constant for the average • = smoothing constant for the trend
Exponential Smoothing with Trend - Example With the following data, calculate the Holt forecast for each period. Assume that the initial forecast for month 1 was 11 units and the trend for that period was 2 units.
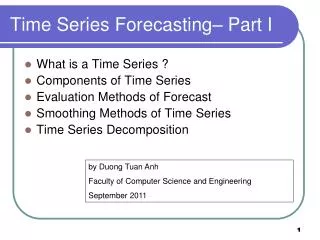
Seasonality • Repeating up and down movements in data • Related to recurring events • Christmas sales of toys • Lawnmower sales • When seasonality exists in data must incorporate into forecasting model
Model with Seasonality • Find average historical demand for each “season” by summing the demand for that season in each year, and dividing by the number of years for which you have data. • Compute the average demand over all seasons by dividing the total average annual demand by the number of seasons. • Compute a seasonal index by dividing that season’s historical demand (from step 1) by the average demand over all seasons. • Estimate next year’s total demand • Divide this estimate of total demand by the number of seasons, then multiply it by the seasonal index for that season. This provides the seasonal forecast.
Example 2 - Seasonality Over the past year Meredith and Smunt Manufacturing had annual sales of 10,000 portable water pumps. The average quarterly sales for the past 5 years have averaged: spring 4,000, summer 3,000, fall 2,000 and winter 1,000. Compute the quarterly index. If annual sales for next year are 11,000, forecast quarterly sales.
Forecast Error Equations • Mean Absolute Deviation (MAD) • Mean Absolute Percent Error (MAPE)
![Statistical Forecasting [Part 2]](https://cdn0.slideserve.com/1092555/statistical-forecasting-part-2-dt.jpg)


![Statistical Forecasting [Part 1]](https://cdn3.slideserve.com/6737421/statistical-forecasting-part-1-dt.jpg)