Download
1 / 59
590 likes | 774 Vues
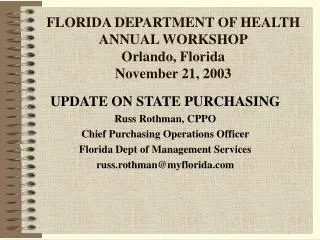
The prevention of reading difficulties at scale: Outcomes from Reading First in Florida Joseph Torgesen Florida Center for Reading Research FCRR Research Symposium, 2007. 100,000 hits per day. 67,945 Unique Visitors. 819,397Page Views. The Nation’s Report Card—Reading 2007.

E N D
The prevention of reading difficulties at scale: Outcomes from Reading First in Florida Joseph Torgesen Florida Center for Reading Research FCRR Research Symposium, 2007
100,000 hits per day 67,945 Unique Visitors 819,397Page Views
The Nation’s Report Card—Reading 2007 Go to Google and type in “The Nation’s Report Card”
270 260 250 1998 2002 2003 2005 2007 220 210 200 1998 2002 2003 2005 2007
Description by performance levels…. Basic Level - Should demonstrate an understanding of the overall meaning of what they read. Should be able to make relatively obvious connections between the text and their own experiences and extend the ideas in the text by making simple inferences. Proficient Level - should be able to demonstrate an overall understanding of the text, providing inferential as well as literal information. Should be able to extend the ideas in the text by making inferences, drawing conclusions, and making connections to their own experiences. The connection between the text and what the student infers should be clear Advanced Level- should be able to generalize about topics in the reading selection and demonstrate an awareness of how authors compose and use literary devices. Should be able to judge text critically and, in general, to give thorough answers that indicate careful thought. http://nces.ed.gov/nationsreportcard/reading/achieveall.asp
8th Grade 4th Grade
http://nationsreportcard.gov/reading_2007/r0001.asp D.C. Improvements at 8th Grade
19 23 48 54 36 51 41 50 18 21 2007 results from National Assessment of Educational Progress at 4th Grade Overall, 34% of 4th graders performed below theBasic Level of Proficiency in 17,600 schools – Florida 30% Percent below Basic 10 20 30 40 50 60 70 80 90 100 White Black Hispanic Poor Non-poor
Some Reading First Facts and Issues 1. Largest federal/state initiative every conducted to prevent early reading difficulties 2. Budget of approximately 6 Billion Dollars over 6 years, more than 300 million for Florida 3. To receive funds, States were required to submit applications that met specific requirements with regard to nature of instruction, assessments, professional development, leadership, etc. 4. Currently, 5,200 schools in 1550 Districts in every state have received awards—based on size of population – 584 schools in Florida
Some Reading First Facts and Issues 8. Reading First money is spent primarily for: Professional Development Curriculum Materials Early assessments Classroom and school libraries 20% can be used at state level- the rest goes to schools
Some Reading First Facts and Issues 1. Reading First legislation was written to require states to use instruction consistent with “scientifically based research in reading.” There is also federal law saying that the feds cannot tell the states what to do in instruction 2. Secretary of Education Margaret Spellings calls it “the most effective and successful reading initiative in the nation's history”—yet its two leaders have been removed from their jobs—biggest charge was overstepping their authority 3. Reading First depends on strong leadership from State Departments of Education – yet they are continually faced with issues of local control, understaffing, and high turnover
Why do we have Reading First? 1. Far too many children, particularly poor and minority children, are being “left behind” when it comes to growth of proficient reading skills 2. Prevention of reading problems is far more effective and humane than trying to remediate after children fail 3. New discoveries from scientific research about reading can provide the basis for improved outcomes for all children
The Intervention in Florida: What schools agree to do in their application to participate 1. Adopt a common, comprehensive core reading program that is to serve as a scaffold for explicit and systematic instruction in phonemic awareness, phonics, fluency, vocabulary, and comprehension strategies 2. Provide at least 90 minutes of protected reading time every day 3. Administer a common set of progress monitoring measures 4 times a year, and a common set of outcome measures once a year. Submit results to FCRR within a specified time schedule 4. Identify some means to provide more intensive instruction to students lagging behind in reading development
The Intervention: What schools agree to do (cont.) 5. Pay for a reading coach to serve K-3 teachers in each school 6. Support attendance of all teachers at a 4-day Reading First Teacher’s Academy during the summer 7. Participate in the state and federal evaluations of Reading First Funding: $300 per K-3 student – minimum 40,000/year, maximum 175,000/year- with declining funds over six years Funding issue: Do you highly fund a small number of schools to show what can be done with truly extraordinary funding, or do you “spread it around” to lots of schools for equity?
Ongoing support from State The work of Regional Reading First Professional Development Coordinators is coordinated by the University of Central Florida – Currently have 26 coordinators for 590 schools, but began with only 12 for 326 Have provided summer academies for teachers (4day), summer conferences for coaches (4 days) and principals (2 days) Provide all assessment training and support through FCRR, including the Progress Monitoring and Reporting Network for student reports Lots of technical assistance about use of data, selection of programs, assessments, etc.
Outcome data from Reading First Schools in Florida: 2006-2007 Three Groups of Schools: Cohort 1 - 4 years of data – 317 schools Cohort 2 - 3 years of data - 70 schools Cohort 3 - 2 year of data -- 197 schools
Cohort 1 = 32,000 per grade Cohort 2 = 6,750 per grade Cohort 3 = 18,900 per grade Student Demographics for all students grades K-3
Miami-Dade = 9,500 per grade Other Dist. = 9,300 per grade Miami has the most difficult demographics of any of the groups Student Demographics for all students Grade K-3
Performance on SAT10 in 1st Grade +4 -7 +5 -3 +1 -0
Performance on SAT10 in 2nd Grade +7 -7 +4 -3 +1 -0
Performance on FCAT in 3rd Grade +8 -5 +3 -4 +3 -3
Percent of Students at Grade Level and Percent with Serious Difficulties in Reading Comprehension across all cohorts – FCAT (SS level) in third grade
Percent of Students at Grade Level and Percent with Serious Difficulties in Reading Comprehension across all cohorts – SAT10 in third grade (FCAT_PRTRNK)
Performance on DIBELS in Kindergarten +18 -11 +10 -6 +6 -3
Performance on DIBELS in 1st grade +8 -6 +7 -5 +6 -3 Best Estimate of year to year increase in % meeting GL = 2.7%/yr. Midyear estimate was 4.3% (50 to 63%)
Performance on DIBELS in 2nd grade +8 -8 +0 +1 +0 +3 Best Estimate of year to year increase in % meeting GL = 2.7%/yr. Midyear estimate was 4.3% (45 to 58%)
Performance on DIBELS in 3rd grade +10 -6 +13 -6 +15 -10 Best Estimate of year to year increase in % meeting GL = 3.3%/yr. Midyear estimate was 4.3% (40 to 53%)
Percent of Students at Grade Level and Percent with Serious Difficulties in Oral Reading Fluency in Grades 1-3 –DIBELS Benchmarks
Percent of Students at Grade Level and Percent with Serious Difficulties in Oral Reading Fluency in Grades 1-3 –Hasbrouck and Tindal Norms
Performance on PPVT in Kindergarten +1 -1 +1 -1 +1 -2
Performance on PPVT in 1st grade +3 -2 +5 -5 +2 -3
Performance on PPVT in 2nd grade +4 -3 +4 -3 +3 -4
Performance on PPVT in 3rd grade +8 -8 +4 -11 +3 -8
Percent of Students at Grade Level and Percent with Serious Difficulties in Oral Vocabulary across all cohorts
Examination of patterns of performance on various progress monitoring and outcome measures -- is an attempt to determine whether areas of concern are improving
Cohort 1 Year to Year changes in performance on a combined measure of PA, Letter knowledge, and decoding Kindergarten End of year Year to Year changes in measure of oral vocabulary
Cohort 2 Year to Year changes in performance on a combined measure of PA, Letter knowledge, and decoding Kindergarten End of year Year to Year changes in measure of oral vocabulary
Cohort 3 Year to Year changes in performance on a combined measure of PA, Letter knowledge, and decoding Kindergarten End of year Year to Year changes in measure of oral vocabulary
Cohort 1 51 48 44 43 44 41 39 38 Year to Year improvement in % of students at “grade level” in oral vocabulary in grades Kindergarten through Third
Cohort 2 43 40 39 37 36 32 32 31 Year to Year improvement in % of students at “grade level” in oral vocabulary in grades Kindergarten through Third
Cohort 3 40 37 37 34 32 30 28 27 Year to Year improvement in % of students at “grade level” in oral vocabulary in grades Kindergarten through Third
Progress in teaching phonemic decoding skills in First Grade
Cohort 1 change across four years – NWF at end of first grade and beginning of Second grade Note: the Grade level standard is for the middle of first grade, and doesn’t change after that. 51% met the NWF benchmark in February of 007
Cohort 2 change across 3 years – NWF at end of first grade and beginning of Second grade Note: the Grade level standard is for the middle of first grade, and doesn’t change after that. 47% met the NWF benchmark in February of 007
Cohort 3 change across two years – NWF at end of first grade and beginning of Second grade Note: the Grade level standard is for the middle of first grade, and doesn’t change after that. Rest of Cohort 3 Miami 50% met the NWF benchmark in February of 007