Download

1 / 20
200 likes | 229 Vues
Understand the significance of experimental design in biology focusing on protein optimization through Design of Experiment (DOE) methodology. Learn about key steps, advantages, and real-world application in maximizing protein production.

E N D
Design of experiment, application in biology 2012 Petr Císař
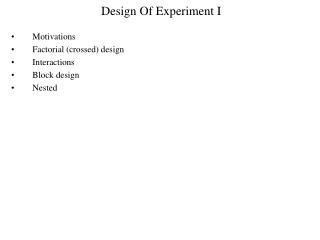
Points of presentation • Motivation • Design of experiment • Introduction • Main steps • Advantages • Application in biology • Process • Method • Results
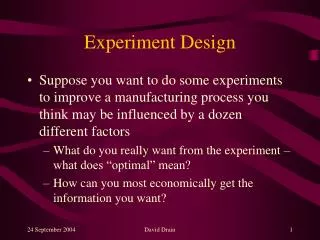
Motivation • Experiment is one of the basic method of human understanding • Experiment is a scientific method used for testing of hypothesis or existing theories • It is a bridge between theory and reality • Why the students do not use sophisticated methods of experiment realization and analysis? • How to design the experiment? • How to analyze the experiment?
Classical approach Response surface Real optimum • One factor at a time (OFAT) • Usually we change only factor – rest is fixed • First we change X1 to get optimum and then we fix it and change X2 Optimum found by OFAT method • OFAT advantages: • Simple • OFAT disadvantages: • Optimum need not to be found • We do not know the relationship between factors and system response • Impossible to understand to the mutual influence between factors • Number of experiments? • The OFAT experiment has to be repeated for each type of system response • We do not know the system
Motivation • Is it possible to do it better? • Measure everything under all conditions. • NO • Create optimal design of experiment and use statistics to understand to it • Design of experiment (DOE).
Design of experiment • DOE – Design Of Experiment • Set of tools for: • Creation of experimental design • Experiment realization • Experiment analysis • with optimal number of experiments • Part of Six Sigma methodologies • Industry standard for process improvement • Used in industry since 1986 • Planed experiment: active change of the process – controlled change of system factors • Outputs: • Minimal number of measurements • List of important factors • The level of influence of controlled and uncontrolled factors to the system response • Interactions between factors • Mathematical model of the system
DOE - Main steps • Identify variables of the system • Identify factors • Select design • Define the levels of factors • Randomize the order of measurements • Realize measurements and record the results Experiment design Experiment analysis • Analyze data • Evaluate the results • Verify results
DOE - features • Repetition – determine variance caused by noise • Randomization – Avoid systematic influence of variables • Block ordering – the same conditions inside the blocks (operator) • Balanced design - explore the state space • Central sample – determine response curvature The influence of the factor Responce factor
DOE • Problem definition: • Aim determination • Factors and their levels • DOE response: • Determination of the most important factors • Determination of main factors influence and interactions, low number of factors • Optimization of factors • Optimization of high number of factors Experts discussion First screening DOE Advanced screening Optimization Impossible by DOE
DOE – Statistical method • The math behind DOE is relatively simple • The students can learn the math by examples • Tools: • ANOVA – Analysis Of Variance – explore the sources of variance in the system – influence of the factors • Regression model – determine mathematical description of the system • Optimization methods - optimization using the mathematical model of system • Everything can be show as pretty pictures • We have to understand what is behind !!!
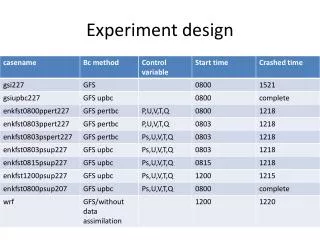
DOE – Pretty pictures • Experimental design table Experimental space Set of tools for:
DOE – Pretty pictures • Main factors plot Interaction plot
Application in biology • Biological experiments: • Typical task: optimization of cultivation conditions • High level of noise • Impossible to know all influencing factors • High number of factors • Difficult to set experimental conditions to defined values • Outliers – unpredictable results • Time consuming experiments • Repeatability of experiment by other experts
Maximization of protein amount • Aim • to optimize production of fusion protein to obtain the highest amount of protein • optimized protein: • fusion protein (FP) - maltose binding protein (MBP) and parathyroid hormone (1-34) (PTH) • Procedure • choose variable parameters and methods for measurement • create procedure for analysis of amount of fusion protein • use DOE for planning and analysis of experiments • locate optimum cultivation conditions • verify optimum by additionally experiments • Authors: Martina Tesařová, Petr Císař, Zuzana Antošová, Oksana Degtjarik, Jost Ludwig and Dalibor Štys
Maximization of protein amount • Process • Growth of bacteria under cultivation conditions • Extraction of the amount of the protein – expensive • Factors and methods – based on expert knowledge • Four factors : • temperature 25; 37; 42 °C • starting OD 0.1; 0.2 • RPM of shaker 150; 200 • time of harvest 1; 3; 6; 12; 24; 48 h
Maximization of protein amount • Extraction of the amount of protein • Expensive and time consuming • Estimation of the amount of protein • Based on staining - electrophoresis gel • Calibration based on extraction of protein and size of blob • Blobs marked by manual annotation -> estimation of the amount of protein • Problem of comparison of blobs between gels – usage of marker
Maximization of protein amount DOE • Fractional factorial design – 3 repetitions • Key factors – temperature, time of harvest
Maximization of protein amount DOE • Response surface • Localized optimum - temperature: 36.6 °C, start OD: 0.1, RPM of shaker:150, time of harvest: 7.5 h
Conclusion DOE • Optimization of amount of protein • Results • 93% of the data are covered by the model – biological system • Two key factors found: temperature and time of harvest • Level of significance – 5% • Localized optimum - temperature: 36.6 °C, start OD: 0.1, RPM of shaker:150, time of harvest: 7.5 h • Optimum verified by 18 testing experiments • DOE was successfully used for the optimization of biological experiment