
Exploring Shared Folds in Genomes and Transcriptomes: Patterns, Biases, and Structural Insights
This study investigates the known and predicted folds across various genomes, emphasizing shared structures and their implications. We examine biases in fold assignment and the degree of commonality among different organisms through fold trees and expression analysis. By clustering phenotypic profiles and protein abundances, we highlight how structural similarities influence functional categories. The findings propose a framework for understanding the finite nature of biological sequences and structures, suggesting connections between genomic and transcriptomic data.

Exploring Shared Folds in Genomes and Transcriptomes: Patterns, Biases, and Structural Insights
E N D
Presentation Transcript
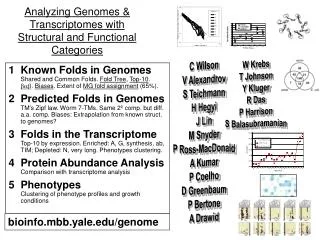
1 Known Folds in GenomesShared and Common Folds. Fold Tree, Top-10. bab. Biases. Extent of MG fold assignment (65%). 2 Predicted Folds in GenomesTM’s Zipf law. Worm 7-TMs. Same 2º comp. but diff. a.a. comp. Biases: Extrapolation from known struct. to genomes? 3 Folds in the TranscriptomeTop-10 by expression. Enriched: A, G, synthesis, ab, TIM; Depleted: N, very long. Phenotypes clustering. Protein Abundance AnalysisComparison with transcriptome analysis PhenotypesClustering of phenotype profiles and growth conditions Analyzing Genomes & Transcriptomes with Structural and Functional Categories W Krebs T Johnson Y Kluger R Das P Harrison S Balasubramanian C Wilson V Alexandrov S Teichmann H Hegyi J Lin M Snyder P Ross-MacDonald A Kumar P Coelho D Greenbaum P Bertone A Drawid bioinfo.mbb.yale.edu/genome
1995 Genomes highlight the Finitenessof the World of Sequences • Bacteria, 1.6 Mb, ~1600 genes [Science269: 496] 1997 • Eukaryote, 13 Mb, ~6K genes [Nature 387: 1] 1998 • Animal, ~100 Mb, ~20K genes [Science282: 1945] 2000? • Human, ~3 Gb, ~100K genes [???]
~100000 genes 229 Folds ~1000 folds (human) (T. pallidum) 91 Functions ~1000 genes The World of Structuresis even more Finite,providing a valuable simplification Likewise, for the world of pathways, functions, regulatory systems.... Cross-referencing http://ecocyc.pangeasystems.com/ecocyc/ecocyc.html
Fold Library vs.Other Fundamental Data structures Parts List Database;Statistical, rather than mathematical relationships and conclusions (Large than physics and chemistry, Similar to Finance (Exact Finite Number of Objects (3,056 on NYSE by 1/98), descrip. by Standardized Statistics (even abbrevs, INTC) and groups (sectors)) Smaller than Social Surveys, Indefinite Number of People, Not Well Defined Vocabulary and statistics.
Hb Building a Library of Know Folds Fusing into a Single Core Structure Template Alignment of Individual Structures P<.000001 Mb Statisticsto Establish Relation-ships (P-values) P<.001 P~1
Cross-Reference: FoldsSequences Organisms (3) Organize Sequences by Genome or Taxon (2) Match Sequences (fasta,blast) 3+5 (4) Results in “Fold Table” (1) Structures in Folds (scop)
Venn Diagrams for Shared Folds of 339 ~300-350 folds (282 folds in scop 1.32 [‘96]) ~120K sequences in OWL 27.1 7 phylogeneticgroups of organisms 5 genomes -- HI, EC (bacteria), MJ (archeon), SC (eukaryote), CE (worm, animal) a/b
20 10 30 Cluster Trees Grouping Initial Genomes on Basis of Shared Folds Fold Tree “Classic” Tree D=S/T S = # shared folds 20 Genomes D = shared fold dist. betw. 2 genomes T= total # folds in both D=10/(20+10+30)
Distribution of Foldsin Various Classes Unusual distribution of all-beta folds
Top-10 Folds in a Genome Depends on comparison method, DB, &c (new top superfamilies via y-Blast, Intersection of top-10 to get shared and common) Yeast Archaea Eubacteria
336: 42 Characteristics of Common, Shared Folds: bab structure All share a/b structure with repeated R.H. bab units connecting adjacent strands or nearly so (18+4+2 of 24) HI, MJ, SC vs scop 1.32
super-secondary structure (bb,TM-TM, abab,aaa) personplant protein fold (Ig) helix strand individual atom (C,H,O...) 1m 100Å 10Å 1Å At What Structural ResolutionAre Organisms Different? Practical Relevance (human) (Pathogen only folds as possible targets) (T. pallidum) Drug
Bias Problem Prediction • Known Structures are Incomplete,Biased Sample from Genome, so... • Resample • Solve Structures • Predict Structures Same Sampling Issues with US Census!! Known Struct.
1 Known Folds in GenomesShared and Common Folds. Fold Tree, Top-10. bab. Biases. Extent of MG fold assignment (65%). 2 Predicted Folds in GenomesTM’s Zipf law. Worm 7-TMs. Same 2º comp. but diff. a.a. comp. Biases: Extrapolation from known struct. to genomes? 3 Folds in the TranscriptomeTop-10 by expression. Enriched: A, G, synthesis, ab, TIM; Depleted: N, very long. Phenotypes clustering. Protein Abundance AnalysisComparison with transcriptome analysis PhenotypesClustering of phenotype profiles and growth conditions Analyzing Genomes & Transcriptomes with Structural and Functional Categories W Krebs T Johnson Y Kluger R Das P Harrison S Balasubramanian C Wilson V Alexandrov S Teichmann H Hegyi J Lin M Snyder P Ross-MacDonald A Kumar P Coelho D Greenbaum P Bertone A Drawid bioinfo.mbb.yale.edu/genome
TM prediction (KD, GES). Count number with 2 peaks, 3 peaks, &c. Similar conclusions to others: von Heijne, Rost, Jones, &c. Divide Predictions into sure and marginal(Boyd & Beckwith’s criteria) TM-helix “prediction”
Yeast has more mem. prots., esp. 2-TMs Similar conclusions to others: von Heijne, Rost, Jones, &c. Overall, no strong preference for particular supersecondary structures Freq. of Number of TM helixes follows a Zipf-like law: F=1/[5n2] In detail, worm has a peak for 7-TMs and E. coli for 12-TMs Comparative Genomics of Membrane Proteins
2º Structure Prediction • Bulk prediction of 2º struc. in genomes • Same fraction of a and b (by element, half each) • Both overall and only for unknown soluble proteins. • Diff From PDB: 31% helical and 21% strand. • Related results: Frishman Not expected since.…..
Different Amino Acid Composition Should Give Different 2º Structure Each a.a. has different propensity for local structure -> Different Compositions (K from 4.4 in EC to 10.4 in MJ, Q too) -> Different Local Structure (but compensation?) Propensities from Regan (beta) and Baldwin (alpha)
How Representative are the Known Structures of the Proteins in a Complete Genome? The issue of Bias • Assess 2º,TM predictions • (+) comprehensive, statistical • (-) predictions inaccurate(~65%) • (-) extrapolate from PDB (esp. TM),domain problem • Is prediction (extrapolation) based on known structures justified? • Length: Genomes Sequences are longer than those in Known Structures • 340 aa for avg. genome seq.(470 aa for yeast) 205 aa for PDB chain~160 aa for PDB domain
Amino Acid Composition How Representative are the Known Structures of the Proteins in Complete Genome?
1 Known Folds in GenomesShared and Common Folds. Fold Tree, Top-10. bab. Biases. Extent of MG fold assignment (65%). 2 Predicted Folds in GenomesTM’s Zipf law. Worm 7-TMs. Same 2º comp. but diff. a.a. comp. Biases: Extrapolation from known struct. to genomes? 3 Folds in the TranscriptomeTop-10 by expression. Enriched: A, G, synthesis, ab, TIM; Depleted: N, very long. Phenotypes clustering. Protein Abundance AnalysisComparison with transcriptome analysis PhenotypesClustering of phenotype profiles and growth conditions Analyzing Genomes & Transcriptomes with Structural and Functional Categories W Krebs T Johnson Y Kluger R Das P Harrison S Balasubramanian C Wilson V Alexandrov S Teichmann H Hegyi J Lin M Snyder P Ross-MacDonald A Kumar P Coelho D Greenbaum P Bertone A Drawid bioinfo.mbb.yale.edu/genome
Gene Expression Datasets: the Transcriptome Yeast Expression Data in Academia: levels for all 6000 genes! X-ref. with other genome data: protein fold features common in Transcriptome.... Young/Lander, Chips, Abs. Exp. Also: SAGE; Samson and Church, Chips; Aebersold, Protein Expression Brown, marray, Rel. Exp. over Timecourse Snyder, Transposons, Protein Exp.
cDNA μArrays From: Duggan DJ, Bittner M, Chen Y, Meltzer P, Trent JM. Expression profiling using cDNA microarrays. Nat Genet 1999 Jan;21(1 Suppl):10-4 Brown PO, Botstein D. Exploring the new world of the genome with DNA microarrays. Nat Genet 1999 Jan;21(1 Suppl):33-7
What is Happening on DNA Chips From: Southern E, Mir K, Shchepinov M. Molecular interactions on microarrays. Nat Genet 1999 Jan;21(1 Suppl):5-9
DNA Chip Performance Characteristics From: Lipshutz RJ, Fodor SP, Gingeras TR, Lockhart DJ. High density synthetic oligonucleotide arrays. Nat Genet 1999 Jan;21(1 Suppl):20-4
Serial Analysis of Gene Expression (SAGE) From: Velculescu VE, Zhang L, Zhou W, Vogelstein J, Basrai MA, Bassett DE Jr, Hieter P, Vogelstein B, Kinzler KW. Characterization of the yeast transcriptome. Cell 1997 Jan 24;88(2):243-51
GenomeComposition TranscriptomeComposition Composition of Genome vs. Transcriptome VGA NS
Composition of Transcriptome in terms of Broad Structural Classes
Which Protein Folds are Highly Expressed? Top-10 folds in genome and tran-scriptome
Composition of Transcriptome in terms of Functional Classes Prot. Syn. energy unclassified transcription transport signaling
Broad Categories Const. in Transcriptome over Timecourse, Not Specific Genes (or Folds) Brown cDNA microarray expts. not as useful for X-ref. at individual timepts Nevertheless, they show same aa composition and fold class usage at different timepts. However, top fold changes and also specific TM proteins....
Different Classes of Membrane Proteins Have Different Changes in Expression Level (esp. 12 TMs) Column gives the expression in aerobic conditions (high sugar, second time-series data point in DeRisi et al.), and other column, in anaerobic conditions (low sugar, high ethanol, last time-series data point in DeRisi et al.). 9 hexose permeases, 1 lactate transporter.
Correlate Expression Level with Functional Category MIPS YFC: 66 bottom classes, 10 top classesAverage correlation of uncharacterized genes is 0.16Similar to Botstein analysis.
Results from Analysis of Correlation of Functional Class and Expression Highest Correlations • Many groups of genes categorized by MIPS do not have higher correlation than random ORFs • Smaller groups tend to have a slightly higher correlation
Going One Step Further: Protein Abundance Levels Gygi/Aebersold: Quantitation of Protein Expression Levels
Going One Step Further: Protein Abundance Levels 116 proteins from Aebersold data (small sample) By definition highly expressed Similar enrichment of amino acids in proteins and mRNA
Analyzing Gene Expression with Transposon System (Micheal Snyder)
Amino Acid Enrichment: lacZ Fusions Compared with mRNA Expression Levels
YBR01w YAL009c YCL029c YBR102c YMR009c YER021w Affected by Another Condition Affected by Cold WT Whole Genome Phenotype Profiles Transposon insertions into (almost) each yeast gene to see how yeast is affected in 20 conditions. Generates a phenotype pattern vector, which can be treated similarly to expression data <-- Conditions --> M Snyder Clustering Conditions
20 Conditions 20 Conditions 28 ORFs in cluster 28 ORFs in cluster Phenotype ORF Clustering k-means clustering of ORFs based on “phenotype patterns,” cross-ref. to MIPs Functional Classes Cluster showing cold phenotype (containing genes most necessary in cold) is enriched in metabolic functions Metabolism Cold
1 Known Folds in GenomesShared and Common Folds. Fold Tree, Top-10. bab. Biases. Extent of MG fold assignment (65%). 2 Predicted Folds in GenomesTM’s Zipf law. Worm 7-TMs. Same 2º comp. but diff. a.a. comp. Biases: Extrapolation from known struct. to genomes? 3 Folds in the TranscriptomeTop-10 by expression. Enriched: A, G, synthesis, ab, TIM; Depleted: N, very long. Phenotypes clustering. Protein Abundance AnalysisComparison with transcriptome analysis PhenotypesClustering of phenotype profiles and growth conditions Analyzing Genomes & Transcriptomes with Structural and Functional Categories W Krebs T Johnson Y Kluger R Das P Harrison S Balasubramanian C Wilson V Alexandrov S Teichmann H Hegyi J Lin M Snyder P Ross-MacDonald A Kumar P Coelho D Greenbaum P Bertone A Drawid bioinfo.mbb.yale.edu/genome