PASW-SPSS STATISTICS
PASW-SPSS STATISTICS. David P. Yens, Ph.D. New York College of Osteopathic Medicine, NYIT dyens@nyit.edu PRESENTATION 2 Data Manipulation Selection, New Variables Data Presentation Graphs, Line Charts, etc. 2010. SELECTION OF CASES. PROBLEM:

PASW-SPSS STATISTICS
E N D
Presentation Transcript
PASW-SPSS STATISTICS • David P. Yens, Ph.D. • New York College of Osteopathic Medicine, NYIT dyens@nyit.edu • PRESENTATION 2 • Data Manipulation • Selection, New Variables • Data Presentation • Graphs, Line Charts, etc. 2010 David Yens, Ph.D. NYCOM
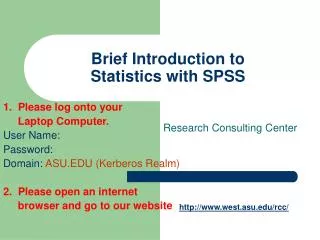
SELECTION OF CASES • PROBLEM: • A data set contains data on children from 5-17 • We need to analyze only those children aged 5-15 • SOLUTION • Data Select Cases • (IBM SPSS, p. 191)
CREATING NEW VARIABLE • PROBLEM • Create a new variable, “Pain,” that is the sum of B1, B2, A1, and A2 • SOLUTION • TRANSFORM COMPUTE VARIABLE • (IBM SPSS, p. 81)
PRESENTATION MODES • FREQUENCIES (IBM SPSS, p. 37) • Bar charts • Histograms • Pie Charts • EXPLORE (IBM SPSS, p. 62) • Boxplot • Stem and Leaf • GRAPHS (SPSS for Dummies) • Wide variety and flexibility