Statistics---SPSS
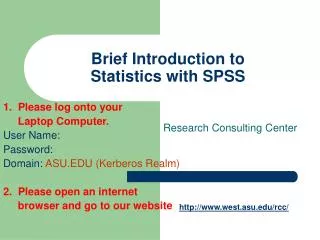
Learn to effectively analyze data using IBM SPSS Statistics software package. Change language, import data, calculate descriptive statistics, draw graphs, perform basic operations, and create grouped frequency distributions with ease.

Statistics---SPSS
E N D
Presentation Transcript
The software name originally stood for Statistical Package for the Social Sciences (SPSS) • SPSS Statistics is a software package used for statistical analysis. Long produced by SPSS Inc., it was acquired by IBM in 2009. • The current versions are officially named IBM SPSS Statistics. Companion products in the same family are used for survey authoring and deployment (IBM SPSS Data Collection), data mining (IBM SPSS Modeler), text analytics, and collaboration and deployment (batch and automated scoring services).
Outline • Change the language • Import the data • Calculate the descriptive statistics • Draw some graphs • Do some basic operations • Create the grouped frequency distribution.
2.Import the data -(1)type the data directly Type the data directly
2.Import the data-(1)type the data directly Type the name of variables
2.Import the data -(2)Use “File”—”Open”—“Data”
2.Import the data -(2)Use “File”—”Open”—“Data”
3.Descriptive Statistics(I)-(1)Mean, Mode, Median, Sum, Std, Var, Min, Max, Quartile, Percentiles
3.Descriptive Statistics(I)-(2)Pie chart , Bar chart, histogram Choose the charts based on the data styles
3.Descriptive Statistics(II)-Mean, Sum, Std, Var, Min, Max, Range
3.Descriptive Statistics(III)-(1)outliers, confidence interval for mean
3.Descriptive Statistics(III)-(2) Box plot, Stem and Leaf, Histogram
5. Do some calculations Define the variable’s name Choose the functions