Download
1 / 47
510 likes | 1.11k Vues
Brief Introduction to Statistics with SPSS. Research Consulting Center. 1. Please log onto your Laptop Computer. User Name: Password: Domain: ASU.EDU (Kerberos Realm) 2. Please open an internet browser and go to our website. http://www.west.asu.edu/rcc/.

E N D
Brief Introduction to Statistics with SPSS Research Consulting Center 1. Please log onto your Laptop Computer. User Name: Password: Domain: ASU.EDU (Kerberos Realm) 2. Please open an internet browser and go to our website http://www.west.asu.edu/rcc/
Brief Introduction to Statistics with SPSS Joe Ryan, Research Consulting Center Rico Rivera, Cindy Owens, & Josh Fox, Statistics Laboratory http://www.west.asu.edu/rcc/
Workshop materials • Workshop Packet titled “Introduction to SPSS 11.5” • Data Files • Location • http://www.west.asu.edu/RCC • Click on the Stat Lab button (located on left side) • Click on Workshops • Click on Data used for Workshops • Click on Workshop for David Gonzales’s Class • In the folder there are three files • Tactile_Acuity.xls (excel data file) • Strength-Injury.sav (SPSS data file) • Vitamin_C.sav (SPSS data file) • Save them to your desktop
Overview of Statistic Workshop (P. 3) • Functions of the Stat Lab & SPSS accessibility • Overview of Research Process • Introduction to SPSS • Input & importing raw data • Editing raw data • Descriptive Statistics • Central Tendency • Dispersion • Presentation of Data: tables, figures, & scatter plot • BREAK (10 minutes) • Inferential Statistics • Stating Hypotheses • Relationships • Paired Sample t-test • ANOVA
Functions of Statistic Laboratory (p. 4) • Operated by the Research Consulting Center (RCC) • Provide access and support for statistical software • Design to assist students enrolled in statistic courses, research methods, biology labs, & any courses that involve the analysis of quantitative data • The staff assist students with aspects of statistical software: SPSS & Excel • Not set up to provide one-on-one tutorial service for students on a regular basis. However, we have and frequently do answer general statistic questions
Accessing the Statistic Laboratory (page 5) • Location: CLCC 107 • Phone: (602) 543-6117 • Website: http://www.west.asu.edu/RCC • Operating hours: See website • When using the lab, please sign in at the front counter
Overview of the Research Process Interpretation How have we answered the questions? Data Analysis Descriptive Statistics Inferential Statistics Measurement Validity - accuracy Reliability - precision Observation What do we to observe? (What are the variables?) How do we do the observations? (What are the instruments and procedures?) How many and which one’s? (What’s the population?) (How do we get the sample?) What is the question? What do we want to know about a (an) - cell - organism - group of organisms - interactions among organisms - relationship of an organism and its environment Research Consulting Center Statistics Lab CLCC 104 www.west.asu.edu/rcc (602) 543-6117
Overview of the Research Process DISCUSSION SECTION Interpretation How have we answered the questions? RESULTS SECTION (Page 6) Data Analysis Descriptive Statistics Inferential Statistics METHODS SECTION Measurement Validity - accuracy Reliability - precision METHODS SECTION Observation What do we to observe? (What are the variables?) How do we do the observations? (What are the instruments and procedures?) How many and which one’s? (What’s the population?) (How do we get the sample?) AT THE END OF LITERATURE REVIEW OR INTRODUCTION What is the question? What do we want to know about a (an) - cell - organism - group of organisms - interactions among organism - relationship of organism and environments Research Consulting Center Statistics Lab CLCC 107 www.west.asu.edu/rcc (602) 543-6117
Procedures for Data Analysis (p. 7) Data StatPak Output Interpretation • Collect & organize data • Input & edit the data • Analyze data or create graphs • State results and interpret
Procedures for Data Analysis (p. 7) Data StatPak Output Interpretation • Collect & organize data • Input & edit the data • Analyze data or create graphs • State results and interpret
Procedures for Data Analysis (p. 7) Data SPSS Output Interpretation • Collect & organize data • Input & edit the data • Analyze data or create graphs • State results and interpret
Basic Features of SPSS (p 8) • Statistical Product and Service Solutions (SPSS) • Software for building and analyzing data files • Easy to learn the basics of data entry, editing and how to perform basic statistical analyses. • After you learn the basics, you can explore a wide range of techniques on your own or with the “Help” option • SPSS can easily import a wide variety of files
Input and edit the data • Input the raw data (Attitudes toward Statistics & Research) • Import an Excel data file (Sensory Lab Data: Tactile_Acuity.xls) • Edit raw data in Variable View
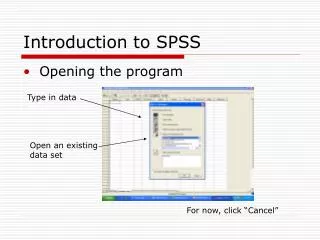
Let’s launch SPSS • SPSS Data Editor (p 9) • Menu & Button Bar • Data View (for inputting data) (p 10) • Variable View (for editing data) (p 11-13) • Output SPSS Viewer • SPSS Chart Editor Please remove last page of your packet and answer the questions.
Using SPSS Data Editor to Input Data (e.g., Research and Statistics Attitude Survey) • Response • Strongly Disagree • Disagree • Agree • Strongly Agree • Sex • Male • Female • Age • Under 25 • 25 – 40 • Over 40 • Response • Strongly Disagree = 1 • Disagree = 2 • Agree = 3 • Strongly Agree = 4 • Sex • Male = 1 • Female = 2 • Age • Under 25 = 1 • 25 – 40 = 2 • Over 40 = 3 • Having ID column will help you keep track of cases • (Back to SPSS)
Using SPSS Data Editor to Input Data (e.g., Research and Statistics Attitude Survey) • On the Data View worksheet, enter the values for each person or case. • In your case, enter you survey, just like Josh. • Editing Data • Variable names, Variable labels, and Values
Using SPSS Data Editor to Input Data (e.g., Research and Statistics Attitude Survey) • On the Data View worksheet, enter the values for each person or case. • In your case, enter you survey, just like Josh. • Next, Josh is going to show you how to import an excel file into SPSS. • On the Data View worksheet, enter the values for each person or case. • In your case, enter you survey, just like Josh. • Next, Josh is going to show you how to import an excel file into SPSS. • Minimize the SPSS window, and open the Excel file on your desktop
Using SPSS Data Editor to Import an Excel data file • First organize the data in Excel (e.g., Tactile Acuity) • The first row can contain the variable names • Recall that variable names • can be up to 8 characters • start with a letter • & have no symbols. • After making adjustments to Excel, • Save the file • Close the file • Next you can import the Excel data into SPSS • (lets go back to SPSS) • File > Open > Data • You get a dialogue box called ‘Open Files’ • Toward the bottom, in ‘Files of Type’, select “All Files” • Select the file you saved (Tactile Acuity) Don’t forget to also save the Tactile Acuity data in SPSS
Review of what we did • Inputted the raw data (Attitude Toward Research and Statistics Data) • Edited the raw data file in Variable View • Imported an Excel data file (Sensory Lab Data: Tactile_Acuity.xls)
Overview: Analyzing Data & Creating Graphs • Level of Measurement • Descriptive Analysis • Presentation of Data • Central Tendency & Variability • Inferential Analysis
Level of Measurement (4 scales of variables) (p. 18, 3rd slide) • Ratio (e.g., lengths, weights, volumes, capacities, rates): • Different categories • Rankable categories • Constant equal-sized Intervals • Absolute Zero (physical significance) (e.g., temperature in Kelvin, time) • Interval (temperature on Celsius and Fahrenheit, age): • Different categories • Rankable categories • Constant equal-sized Intervals (can be expressed numerically) • Ordinal (e.g.., dominance hierarchy): • Different Categories • Categories are rankable • Nominal (a.k.a. attributes) • Different Categories (e.g.., sex, species, phylum, location)
Descriptive Statistics (p. 19, 1st slide) • Presentation of entire distribution • Frequency Distribution: organized tabulation of the number (or percentage) of individuals in each category on the scale of measurement • Can be presented in a table or in a graph • Measures of Central Tendency • Identifies a single score that represents an entire data set • Best example of average or most typical score • Measures of Variability (Dispersion) • Provides a description of how spread out the scores are in a distribution • Provides a measure of how accurately a single score selected from a distribution represents the entire set
Back to SPSS (P. 20; take notes) • Create table frequency & a chart • Create measures of central tendency • Create measures of dispersion • Create scatter plot (using Strength_Injury data) • Editing a scatter plot by using SPSS Chart editor
How can we summarize the distribution of the below variable? Gender • Male • Female What is the level of measurement? (page 18, 3rd slide) Nominal Should we use a bar graph or a histogram? (page 19, 2nd slide) Bar Graph
Presentation of an Nominal Variable • Click Analyze > click Descriptive Statistics > then click Frequencies. • You should see a dialog box called Frequencies. • On the left side you should see a list of variables and on the right you should see a Variable(s) box. • In the variable list (left side) look for a variable either called “Gender” or sex. • Select this variable by clicking on it, then click ►to place the variable in the Variable(s) box. • Make sure that there is a check marknext to Display frequency tables. • Click Charts. • You will see a dialog box called Frequencies: Charts • Click Bar Charts. Click Continue. • Click OK.
We want to know the central tendency for the below variables. • Age of respondent 18 – 89. Actual age in years What is the level of measurement? Which measure of central tendency should we use?
Central Tendency & Variability for Interval & Ratio Variables • Click Analyze > click Descriptive Statistics > then click Descriptive. • You will see a dialog box called Descriptives. • Select the variable • one is called “AGE”. • Click Options. You will see a dialog box called Descriptives: Options • By default Mean,Std Deviation, Minimum, & Maximum should be selected • click Continue. • Click OK.
Summary of what we have discussed. • Presentation of the variable distributions • Central tendency • Variability (dispersion)
Creating & Editing a Scatter Plot • Open a new data file called “Strength_Injury” • Click on Graphs > Scatterplots • Choose the simple panel and click on Define • X (horizontal) axis: Glute Strength • Y (vertical) axis: Abdomen & Lower Back Strength
Break • Please be back in 10 minutes
Inferential Statistics • Techniques that allow us to study samples and then make generalizations about the population from which they were selected. • Sample: a set of individuals selected from a population, usually intended to represent the population in a research study. • Population: The collection of all individuals (cases) in which the researcher is interested.
Inferential Statistics • Statistical Significance (probability) • Probability is used to predict what kind of samples are likely to be obtained from a population. • Probability establishes a connection between populations and samples • Relying on this connection, inferences of populations can based on sample statistics
Research Question • Actual research is conducted using a sample • Hypothesis test: a statistical method that uses sample data to evaluate a hypothesis about a population parameter. • Opposing Hypotheses stated in terms of population parameters. • Null Hypothesis (e.g., no difference, no change, no effect, or no relationship in the population from which the sample is drawn) • Alternative Hypothesis (e.g., there is a difference, a change, an effect, or a relationship for the general population).
Research Question • Actual research is conducted using a sample • Hypothesis test: a statistical method that uses sample data to evaluate a hypothesis about a population parameter. • Opposing Hypotheses stated in terms of population parameters. • Null Hypothesis (e.g., no difference, no change, no effect, or no relationship in the population from which the sample is drawn) • Alternative Hypothesis (e.g., there is a difference, a change, an effect, or a relationship for the general population).
Research Questions & the Applicable Statistical Procedures • Relationships • Correlation • Regression • Differences between 2 sample means • Independent samples • Independent t-test • Dependent samples • Paired-sample t-test • Differences among 2 or more independent sample means • Analysis of Variance (ANOVA)
Relationships • Science involves a search for relationships between variables. For example, is there is a relationship between the amount of rainfall and crop growth? • Sometimes, it is reasonable to expect a consistent, orderly relation between two variables: As X changes, Y also changes in a predictable way.
Linear Relationships with SPSS • Correlation Coefficient (Strength_Injury data) Analyze > Correlate > Bivariate … • Regression Analysis (Strength_Injury data) Analyze > Regression > Linear … Regression Equation: Y = a + bx • a = y intercept • B = coefficient (slope) • R square • If p < .05 then significant
Linear Relationships with SPSS • Regression Equation Model Abdomen = 5.20 + .76(Glute) • Is the slope significant? Is p < .05? In SPSS, “Sig.” means p.
R square R Square can range between 0 to 1 In this example, we have an R Square = .24 What does a low versus a high R Square look like in a scatter plot?
R square Low R Square High R Square
Two Sample t Tests with SPSS • Independent-Samples t Test (Tactile_Acuity Data; Sex & age) Analyze > Compare Means > Independent-Samples T Test … • t test • If p < .05 then significant • Paired-Samples t Test (usually for pre & post test) Analyze > Compare Means > Paired-Samples T Tests … • t test • If p < .05 then significant
Differences among 2 or more independent sample means with SPSS • Analysis of Variance (ANOVA; Vitamin Data) Analyze > Compare Means > One-Way ANOVA … • F test • If p < .05 then significant
Review of Workshop • Overview of Research Process • Introduction to SPSS • Input & importing raw data • Editing raw data • Analyzing Data & Create Graphs with SPSS • Descriptive Statistics • Central Tendency • Dispersion • Presentation of Data: tables, figures, & scatter plot • Inferential Statistics • Stating Hypotheses • Relationships • Two sample t-tests: Independent & Paired • ANOVA
Thanks for having us • Please fill out an “SPSS Workshop Evaluation” which is located at end of packet. • Please close SPSS, log off your computer & shut off your computer • Do keep the “Research and Statistics Attitude Survey” you filled out earlier. • For further information, Please go to www.west.asu.edu/rcc Have a good day.