Introduction to SPSS
Introduction to SPSS. Prof. Ramez Bedwani. Outcomes. By the end of this lecture, the student will be able to Know definition, uses and types of statistics. Faculty of Allied Medical Science. Biostatistics MLST-201. Introduction: What is SPSS?.

Introduction to SPSS
E N D
Presentation Transcript
Introductionto SPSS Prof. Ramez Bedwani
Outcomes • By the end of this lecture, the student will be able to Know definition, uses and types of statistics.
Faculty of Allied Medical Science Biostatistics MLST-201
Introduction: What is SPSS? • Originally it is an acronym of Statistical Package for the Social Science but now it stands for Statistical Product and Service Solutions • One of the most popular statistical packages which can perform highly complex data manipulation and analysis with simple instructions
Basic structure of SPSS • There are two different windows in SPSS • 1st – Data Editor Window - shows data in two forms • Data view • Variable view • 2nd – Output viewer Window – shows results of data analysis • *You must save the data editor window and output viewer window separately. Make sure to save both if you want to save your changes in data or analysis.*
Data view vs. Variable view • Data view • Rows are cases • Columns are variables • Variable view • Rows define the variables • Name, Type, Width, Decimals, Label, Missing, etc. • Scale – age, weight, income • Nominal – categories that cannot be ranked (ID number) • Ordinal – categories that can be ranked (level of satisfaction)
Data Editor • Data Editor Spreadsheet-like system for defining, entering, editing, and displaying data. Extension of the saved file will be “sav.”
Output Viewer • Output Viewer Displays output and errors. Extension of the saved file will be “spv.”
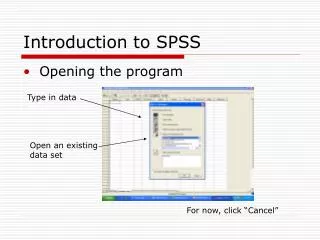
Opening SPSS • The default window will have the data editor • There are two sheets in the window: 1. Data view 2. Variable view
Click Data View window • The Data View window This sheet is visible when you first open the Data Editor and this sheet contains the data • Click on the tab labeled Variable View
Variable View window • This sheet contains information about the data set that is stored with the dataset • Name • The first character of the variable name must be alphabetic • Variable names must be unique, and have to be less than 64 characters. • Spaces are NOT allowed.
The basic analysis of SPSS that will be introduced in this class • Frequencies • This analysis produces frequency tables showing frequency counts and percentages of the values of individual variables. • Descriptives • This analysis shows the maximum, minimum, mean, and standard deviation of the variables
Opening the sample data • Open ‘Employee data.sav’ from the SPSS • Go to “File,” “Open,” and Click Data
Opening the sample data • Go to Program Files,” “SPSSInc,” “SPSS16,” and “Samples” folder. • Open “Employee Data.sav” file
Frequencies • Click ‘Analyze,’ ‘Descriptive statistics,’ then click ‘Frequencies’
Click Click Frequencies • Click gender and put it into the variable box. • Click ‘Charts.’ • Then click ‘Bar charts’ and click ‘Continue.’
Click Frequencies • Finally Click OK in the Frequencies box.
Click Descriptives • Click ‘Analyze,’ ‘Descriptive statistics,’ then click ‘Descriptives…’ • Click ‘Educational level’ and ‘Beginning Salary,’ and put it into the variable box. • Click Options
Click Click Descriptives • The options allows you to analyze other descriptive statistics besides the mean and Std. • Click ‘variance’ and ‘kurtosis’ • Finally click ‘Continue’
Descriptives • Finally Click OK in the Descriptives box. You will be able to see the result of the analysis.