Introduction to SPSS
Introduction to SPSS. Ester Appelgren , Senior lecturer/Associate professor Journalism studies, Södertörns högskola 2012-11-12. Today’s agenda, and your lab. What is SPSS?. SPSS= Statistical Package for the Social Sciences Graphic interface in contrast to other statistical software

Introduction to SPSS
E N D
Presentation Transcript
Introduction to SPSS Ester Appelgren, Senior lecturer/Associate professor Journalism studies, Södertörns högskola 2012-11-12
What is SPSS? • SPSS= Statistical Package for the Social Sciences • Graphic interface in contrast to other statistical software • Often used for survey analysis • Companies may use SPSS for analyzing their performance and predict the future, for example using predictive analysis • Researchers also use SPSS for many other types of studies and research methods, one example: Quantitative content analysis
Example: Alumnisurveys with journalism students • Alumnisurveys at Södertörn University, Department of Journalism, School of Media Communication and IT. • The studies are conducted by Professor Gunnar Nygren • Students are hired to dotelephoneinterviews • Students code the surveys to SPSS format • Students carryoutthesisprojects (Bachelor=C-level) using the data • In this example, a recent bachelorthesis is used: Vem får jobbet? – En kvantitativ studie om arbetsmarknaden för journalister utbildade vid Södertörns högskola, Emma Hultberg och Lisa Rogert. Kandidatuppsats Journalistik vid Institutionen för kommunikation, medier och it, VT 2011.
However, my chartdoesn’taccount for all of the former students that are not working in journalism today
Enter the condition that must be metusing variables and logical operators
Whenrunning a frequency table, the unwanted observations are not included
There are several options in SPSS to come up with the table I just showed you • For exampleusing: • Crosstabs • Suitable for occationalanalysis of two or three variables • Split file • Good for dividing and sorting the dataset once and for all, and runningseveral cross tabulations on this particular data split, for exampledemographic variables such as sex, age, income.
Deselect”Observed” if you do not want the number of observations, and selectpercentages (row, column or total)
If you want to present the resultsbased on the total percentages, calculate this on your own, for example by usingexcel.
Statistics: Many options • Analyze > DescriptiveStatistics > Descriptives • Analyze > DescriptiveStatistics > Frequences • Analyze > DescriptiveStatistics > Explore • Analyze > CompareMeans > Means • And a variety of tests among the meny options
Consultliterature on statistics and research methods, and always talk to your supervisor whenconductingstatisticalanalysis as a part of your master thesisproject! !
Reading examples! SPSS steg för steg – Lars Wahlgren, 2008. Studentlitteratur Statistisk verktygslåda – samhällsvetenskaplig orsaksanalys med kvantitativa metoder – Göran Djurfeldt et al., 2010. Studentlitteratur
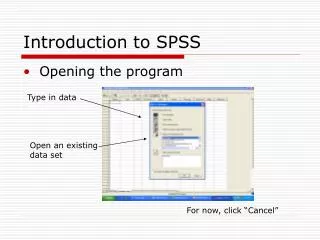
Öpen a datafile in SPSS • .sav (SPSS format) • Excel (File has to be organized in a specificmanner) • A variety of other formats
SPSS: Load data Click ”MoreFiles” and search for the excelfile. It won’tappearif you do not click on ”files of type..” and chooseexcel. Clickopen and OK in the nextstage.
Example of an excelfilestructured so that it is possible to open in SPSS The first row, type in the variable names Eachrow is a unity of analysis. Usenumbersinstead of words, for example: 1=Female, 2=Male, 3= Unknown
For multiple response variables, there are a few exceptions that you need to handle • Example: We want to know if the words “Government, Sweden, Europe and USA are mentioned in the content of 500 articles that we have coded as a dataset. • Then we have to handle this as a multiple response variable as all of the words, or none of the words may have been mentioned in the analyzed articles. • All of the four words will become a single variable that can be either 1=The word is mentioned, or 0=Not mentioned
When coding the articles into a data set, it will look something like this • From the beginning, the variable was called V6 Word mentionedand the alternatives were: • Government • Sweden • Europe • USA • However,as the variable Word can have multiple values at the same time, if several of the words are mentioned in the article, we need to split the variable into one for each option. • Later on, in SPSS we will re-build this variable making it into a multiple response variable. V1 Article ID V2 Coder V3 Newspaper 1=Dn, 2=Svdosv.. … V6 Word: Government 1=Mentioned 0=Not mentioned V7 Word: Sverige 1=Mentioned 0=Not mentioned V8 Word: Europe 1=Mentioned 0=Not mentioned V9 Word: USA 1=Mentioned 0=Not mentioned
How to create a multiple response variable Analyze>Multiple response>Define Variable Sets..