Chapter 4: Variability
Chapter 4: Variability. Variability. The goal for variability is to obtain a measure of how spread out the scores are in a distribution. A measure of variability usually accompanies a measure of central tendency as basic descriptive statistics for a set of scores. .

Chapter 4: Variability
E N D
Presentation Transcript
Variability • The goal for variability is to obtain a measure of how spread out the scores are in a distribution. • A measure of variability usually accompanies a measure of central tendency as basic descriptive statistics for a set of scores.
Central Tendency and Variability • Central tendency describes the central point of the distribution, and variability describes how the scores are scattered around that central point. • Together, central tendency and variability are the two primary values that are used to describe a distribution of scores.
Variability • Variability serves both as a descriptive measure and as an important component of most inferential statistics. • As a descriptive statistic, variability measures the degree to which the scores are spread out or clustered together in a distribution. • In the context of inferential statistics, variability provides a measure of how accurately any individual score or sample represents the entire population.
Variability (cont.) • When the population variability is small, all of the scores are clustered close together and any individual score or sample will necessarily provide a good representation of the entire set.
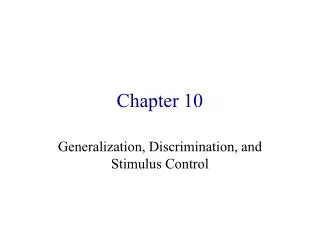
Types of Variability Two Distributions, Large Variance and Small Variance In Data Two Distributions Same Variance Difference in Score Values
Variability (cont.) • On the other hand, when variability is large and scores are widely spread, it is easy for one or two extreme scores to give a distorted picture of the general population.
Measuring Variability • Variability can be measured with • the range • the interquartile range • the standard deviation/variance. • In each case, variability is determined by measuring distance.
The Range 10.5 (URL) 10 8 6 5 3 2 1.5 (LRL) • The range is the total distance covered by the distribution, from the highest score to the lowest score (using the upper and lower real limits of the range). R = 10.5 – 1.5 = 10
The Interquartile Range • The interquartile range is the distance covered by the middle 50% of the distribution (the difference between Q1 and Q3). Q1 = A portion of a distribution in which the lower 25% of Scores fall (or at or below the 25th percentile) Q3 = A portion of a distribution in which the upper 25% of Scores fall (or at or above the 75th percentile)
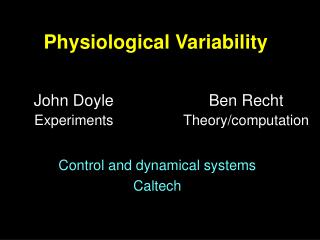
Figure 4.2 Frequency distribution for a population of N = 16 scores. The first quartile is Q1 = 4.5. The third quartile is Q3 = 8.0. The interquartile range is 3.5 points. Note that the third quartile (Q3) divides the two boxes at X = 8 exactly in half, so that a total of 4 boxes are above Q3 and 12 boxes are below it.
Semi-Interquartile Range • The semi interquartile range is the interquartile range divided by 2. 3.5 ÷ 2 = 1.75
Use of SIQR? The Semi Interquartile Range is the half difference between the 75th percentile(Q3) and 25th percentile(Q1). It is a robust measure of variability.
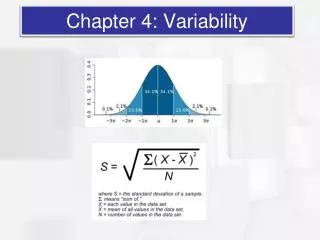
The Standard Deviation • Standard deviationmeasures the standard distance between a score and the mean.
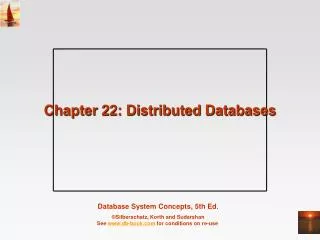
4 Step Calculation of SD 1. Compute the deviation or X –M for each score. • Square each deviation. • Sum the squared deviations (sum of squares, SS) and then dividing by n-1 which give you the Sample Variance. 4. Take the square root of the variance to obtain the standard deviation.
1 2 3 Result 4
Properties of the Standard Deviation • If a constant is added to every score in a distribution, the standard deviation will not be changed. • If you visualize the scores in a frequency distribution histogram, then adding a constant will move each score so that the entire distribution is shifted to a new location. • The center of the distribution (the mean) changes, but the standard deviation remains the same.
Properties of the Standard Deviation (cont.) • If each score is multiplied by a constant, the standard deviation will be multiplied by the same constant. • Multiplying by a constant will multiply the distance between scores, and because the standard deviation is a measure of distance, it will also be multiplied.
The Mean and Standard Deviation as Descriptive Statistics • If you are given numerical values for the mean and the standard deviation, you should be able to construct a visual image (or a sketch) of the distribution of scores. • As a general rule, about 70% of the scores will be within one standard deviation of the mean, and about 95% of the scores will be within a distance of two standard deviations of the mean.