Download
1 / 49
490 likes | 727 Vues
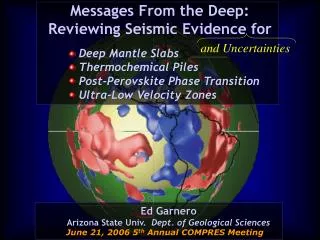
Messages From the Deep: Reviewing Seismic Evidence for Deep Mantle Slabs Thermochemical Piles Post-Perovskite Phase Transition Ultra-Low Velocity Zones. and Uncertainties. Ed Garnero Arizona State Univ. Dept. of Geological Sciences. June 21, 2006 5 th Annual COMPRES Meeting.

E N D
Messages From the Deep: • Reviewing Seismic Evidence for • Deep Mantle Slabs • Thermochemical Piles • Post-Perovskite Phase Transition • Ultra-Low Velocity Zones and Uncertainties Ed Garnero Arizona State Univ. Dept. of Geological Sciences June 21, 2006 5th Annual COMPRES Meeting
Multidisciplinary research conducted in collaboration with: • Avants, Megan (UCSC) • Ford, Sean (UCB) • Hernlund, John (IPGP) • Hutko, Alex (UCSC) • Igel, Heiner (U Munich) • Lay, Thorne (UCSC) • Manga, Michael (UCB) • McNamara, Allen (ASU) • Rokosky, Juliana (UCSC) • Rost, Sebastian (U Leeds) • Schmerr, Nick (ASU) • Thomas, Christine (U Liverpool) • Thorne, Mike (U Alaska) • Williams, Quentin (UCSC)
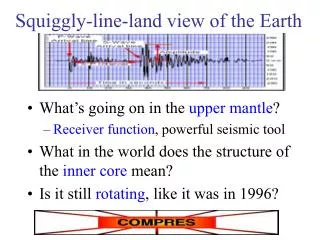
-- Today -- • Some Seismo Truths: • Important modeling uncertainties/trade-offs • Outlook: possible things to come • Recent results and interpretations • Focus on deep mantle ‘high resolution’ work • Draw connections to global scales/processes • inferred from long wavelength studies
Isaacs, Oliver, Sykes [1969] • Why care?…We’d like to better understand: • Mode/style of mantle convection • Depth extent, nature of subduction • Source of hot spot magma • Mantle H2O budget/cycle • Transition zone structure, dynamics • Nature, structure of fluid and solid cores • Thermal evolution/budget of deep interior
B+ C A+ B- C- C A+ B D- D- B C- A C F F Seismology Report Card Transition zone layering/topography Deep mantle heterogeneity Deep mantle “piles” D” Vs discontinuity/layering D” Vp discontinuity/layering D” anisotropy Ultra-low velocity zone CMB topography
1) Poor constraints regarding where on seismic raypath observables occur (travel time delays, extra arrivals, shear wave splitting, etc) ao Amplitude to Time inner Seismology Report Card Five reasons for bad “Constraints” grades
Seismology Report Card Five reasons for bad “Constraints” grades 1) Poor constraints regarding where on seismic raypath observables occur (travel time delays, extra arrivals, shear wave splitting, etc) a’ ao Amplitude to t’ Time inner
Seismology Report Card Five reasons for bad “Constraints” grades 1) Poor constraints regarding where on seismic raypath observables occur (travel time delays, extra arrivals, shear wave splitting, etc) a’ ao Amplitude to t’ Time inner
New arrival! Amplitude Time inner Seismology Report Card Five reasons for bad “Constraints” grades 1) Poor constraints regarding where on seismic raypath observables occur (travel time delays, extra arrivals, shear wave splitting, etc) 2) Modeling trade-off between discontinuity location & isotropic heterogeneity
Seismology Report Card Five reasons for bad “Constraints” grades 1) Poor constraints regarding where on seismic raypath observables occur (travel time delays, extra arrivals, shear wave splitting, etc) 2) Modeling trade-off between discontinuity location & isotropic heterogeneity 3) Globally, only very long wavelength structure is retrievable, which involves significant smearing, and may not accurately depict physics of interior
~ 2502 km ~ 1002 km ~ 200 x 700 km Seismology Report Card Five reasons for bad “Constraints” grades 1) Poor constraints regarding where on seismic raypath observables occur (travel time delays, extra arrivals, shear wave splitting, etc) 2) Modeling trade-off between discontinuity location & isotropic heterogeneity 3) Globally, only very long wavelength structure is retrievable, which involves significant smearing, and may not accurately depict physics of interior 4) Only fraction of a percent of the globe has been probed at “high resolution”, and hence projection of results to global scales is conjecture
Seismology Report Card Five reasons for bad “Constraints” grades 1) Poor constraints regarding where on seismic raypath observables occur (travel time delays, extra arrivals, shear wave splitting, etc) 2) Modeling trade-off between discontinuity location & isotropic heterogeneity 3) Globally, only very long wavelength structure is retrievable, which involves significant smearing, and may not accurately depict physics of interior 4) Only fraction of a percent of the globe has been probed at “high resolution”, and hence projection of results to global scales is conjecture 5) Still using 1-D techniques to get 3-D answers….
Ignoring Embracing Ostracizing Canonizing Enslaving : : Messages From the Deep: Reviewing Seismic Evidence for Deep Mantle Slabs, Thermochemical Piles, Post-Perovskite Phase Transition, Ultra-Low Velocity Zones A Mineral Physicist’s Guide to Disbelieving Seismologists
Seismology Report Card: Grades Rapidly Improving ! • Unparalleled seismic network seismometer populations • (e.g., NSF-funded EarthScope’s USArray) • Enables technique refinement/development • Permits structural retrieval at smaller scale lengths • Better computational capabilities • 2- and 3-D wave propagation computations doable • We are approaching capabilities of benchmarking solution structures • Advances in mineral physics, geodynamics, & geochemistry • Provides significant guidance of our research targets and goals
Recent Seismic Results • Some short seismic modeling vignettes relating to: • Slabs in the lower mantle • Post-perovskite phase transition • Ultra-low velocity zone • Deep mantle piles?
Recent Seismic Results 200-800 km depth Upper mantle, transition zone structure in the central Pacific 2400-2800 km depth D” discontinuity topography 400-1000 km depth Slab detection from seismic reflections between 2400-2800 km depth D” fine-scale layering 2800-2900 km depth Ultra-low velocity zone structure
Recent Seismic Results 200-800 km depth Upper mantle, transition zone structure in the central Pacific 2400-2800 km depth D” discontinuity topography 400-1000 km depth Slab detection from seismic reflections between 2400-2800 km depth D” fine-scale layering 2800-2900 km depth Ultra-low velocity zone structure
Long wavelength suggestion: Some slabs continue to CMB. dVs: Grand [2002] Hutko, Lay, Garnero, Revenaugh [Nature, 2006]
Fine-Scale D” Structure Beneath the Cocos Plate Thomas, Garnero, Lay [JGR, 2004]
A few % discontinuous dVs increase is consistent • with the post-perovskite phase transition Observations: • 200-300 km • above CMB • 0.5-3% • velocity • increase • consistent • with onset • of post- • perovskite • phase e.g., Murakami et al. [Science, 2004] Lay et al. [EOS, 2005] Lay et al [PEPI, 2004]
Fine-Scale D” Structure Beneath the Cocos Plate Results: Vertical Step in D” Discontinuity: Height of D” increases by 100 km over >200 km horizontally Hutko, Lay, Garnero, Revenaugh [Nature, 2006]
Fine-Scale D” Structure Beneath the Cocos Plate Hutko, Lay, Garnero, Revenaugh [Nature, 2006]
D” anisotropy After Crampin [1981]
D” anisotropy After Crampin [1981]
D” anisotropy The apparent step in the D” layer coincides with a change in D” anisotropy parameters Hutko et al. [Nature, 2006, in press] S, Sdiff ScS Garnero, Maupin, Lay, Fouch [Science, 2004] Maupin,Garnero,Lay,Fouch [JGR, 2005] Rokosky, Lay, Garnero [EPSL, 2006, in press]
Recent Seismic Results 200-800 km depth Upper mantle, transition zone structure in the central Pacific 2400-2800 km depth D” discontinuity topography 400-1000 km depth Slab detection from seismic reflections between 2400-2800 km depth D” fine-scale layering 2800-2900 km depth Ultra-low velocity zone structure
Raw array data: Fiji EQ recorded on the Canadian Yellowknife Array Rost,Garnero,Williams [in prep., 2006]
Array processed data: Each trace = stack at a different Incoming angle to the YKA array Rost,Garnero,Williams [in prep., 2006]
Back projecting along determined back azimuth and slowness of each precursor permits estimation of reflection location that matches differential time between precursor and the direct PP wave Rost,Garnero,Williams [in prep., 2006]
Recent Seismic Results 200-800 km depth Upper mantle, transition zone Structure in the central Pacific 2400-2800 km depth D” discontinuity topography 400-1000 km depth Slab detection from seismic reflections between 2400-2800 km depth D” fine-scale layering 2800-2900 km depth Ultra-low velocity zone structure
Ultra-low velocity zones at Earth’s core mantle boundary Williams and Garnero [Science, 1996]
Ultra-low velocity zones at Earth’s core mantle boundary Not detected globally Isolated anomalous zones • Best attempt at global coverage ( ~40 % ) • Thickness depends of several assumptions • Uncertainties in global ULVZ details quite large ULVZ Thickness (km) Thorne and Garnero [JGR, 2004]
Ultra-low velocity zones at Earth’s core mantle boundary • Best-fit model properties: • Thickness : 8.5 (1) km • DVP : -8 (2.5) % • DVS : -25 (4) % • Dr : +10 (5) % Rost,,Garnero,Williams,Manga [Nature, 2005]
Ultra-low velocity zones at Earth’s core mantle boundary Conceptual model possibility • 5 to 30 vol.% melt • no spreading along CMB • trapped intercumulus liquid • incompatible-element enriched liquid • crystals are initially overgrown and trap residual • requires large overlying thermal anomaly • downward percolation of melt • correlation to dynamic instabilities/upwellings • probably a fixed base for mantle upwellings Rost, Garnero, Williams, Manga [Nature, 2005]
Recent Seismic Results 200-800 km depth Upper mantle, transition zone structure in the central Pacific 2400-2800 km depth D” discontinuity topography 400-1000 km depth Slab detection from seismic reflections between 2400-2800 km depth D” fine-scale layering 2800-2900 km depth Ultra-low velocity zone structure
Central Pacific D” Layering dVs [Grand, 2002] Lay, Hernlund, Garnero, Thorne [Science, 2006, in review] Avants, M., T. Lay, S. Russell, and E.J. Garnero [JGR, 2006] Avants, M., T. Lay, and E.J. Garnero [GRL, 2006]
Central Pacific D” Layering Lay, Hernlund, Garnero, Thorne [Science, 2006, in review]
Central Pacific D” Layering ~ 500 km Bin3 Bin2 Bin1 ~ 1000 km Lay, Hernlund, Garnero, Thorne [Science, 2006, in review]
Recent Seismic Results 200-800 km depth Upper mantle, transition zone structure in the central Pacific 2400-2800 km depth D” discontinuity topography 400-1000 km depth Slab detection from seismic reflections between 2400-2800 km depth D” fine-scale layering 2800-2900 km depth Ultra-low velocity zone structure
SS waves and precursors Probing the Transition Zone Regionally: Central Pacific Schmerr and Garnero[2006, JGR, in press]
Probing the Transition Zone Regionally: Central Pacific • Thinning of the TZ • ( ~ 15 km average) • 410 disc slightly depressed • - 660 disc upwarped Schmerr and Garnero[2006, JGR, in press]
Step in D” discontinuity: consistent w/ slab piling/folding Slabs: at least to 1000 km Thinned transition zone What about chemically distinct piles in the deep mantle? Very localized ULVZ: dense, partial melt, base of upwelling D” stratification: LLSVP, pPv, ULVZ Thorne, Garnero, Grand [2004, PEPI]
Sharp top Sharp “edges” to low velocities inferred from seismic waveforms Ni and Helmberger [2003,2005, Science, EPSL] Ford, Garnero,McNamara [2006, JGR] mantle Caribbean anomaly core African anomaly Pacific anomaly South pole
Indirect evidence from global tomography red: lowest velocities for S20RTS green: strongest lateral VS gradients Thorne, Garnero, Grand, PEPI., 2004
Deep mantle shear velocity and hot spots Model: Grand 2002 Iso-velocity contour: - 0.7%Hotspots: Thorne, Garnero, Grand [2004, PEPI]
Today: lots of seismically imaged short scale details in just a few spots of the volume of the interior “there are known unknowns and unknown unknowns” Point: Where we’re afforded the ability to image in great detail, richness in complexity is apparent
garnero@asu.edu http://garnero.asu.edu Garnero [Ann. Rev. , 2000] Garnero, Maupin, Lay, Fouch [Science, 2004]