Download
1 / 29
290 likes | 306 Vues
Understanding the interaction of 4-Chlorocatechol (CT) with Titanium Dioxide is crucial for studying photocatalysis. This presentation discusses the motivation, goals, experimental procedures, and results in investigating surface structures formed during these interactions.

E N D
Surface Structures of 4-Chlorocatechol Adsorbed on Titanium DioxideScott T. Martin, Janet M. Kesselman, David S. Park, Nathan S. Lewis, and Michael R. Hoffman An Oral Presentation for CE 468 February 8, 2000 Professor: J.F. Gaillard By: Mike Marsolek
Overview of the Presentation I - Motivation for the presentation II - Goals of the Paper III - Experimental Procedure IV - Results and Applications
Motivation - Why are we interested? • Titanium Dioxide (TiO2) is used extensively in photocatalysis • Adsorption of reactants onto the TiO2 surface is central to understanding the mechanism as a whole • 4-Chlorocatechol (CT) is an intermediate in the TiO2 catalyzed photooxidation of 4-chlorophenol • I will be doing research on photobiocatalysis, which will examine the effect of using photocatalysis as either a pre or post treatment to bioremediation
What is Photocatalysis? • Photocatalysis is a technique used to degrade toxic species into more environmentally friendly forms • Absorption of light with energy equal to or greater then the band gap energy results in elevation of an electron from the “valence band” to the “conduction band” • This elevation results in a positively charged hole in the valence band • When these charge carriers occur at the surface there is potential for oxidation/reduction reactions
Characteristics of TiO2 • Ti forms HCP Structures • For TiO2: pKa1 = 8.8, pKa2 = 12.7 • TiO2 has a large band gap energy, 3.3 eV, which means it must be activated by UV light
What Does Adsorption Have to do With Photocatalysis? TiO2 can oxidize chlorinated hydrocarbons only if the hydrocarbon is sorbed onto the surface Therefore, adsorption is of fundamental interest in the study of photocatalysis A better understanding of adsorption can therefore lead to better models and more successful applications
Why 4-Chlorocatechol? • 4-Chlorocatechol is an intermediate in the oxidation of 4-chlorophenol
Goals of the Paper and Research “To investigate the surface structures formed between an organic substrate (CT) and TiO2 in the context of understanding how these specific surface interactions affect photoreactivity.” To understand how pH and substrate concentration affects adsorption To develop an adequate model using a generalized double layer (Gouy-Chapman) approach
Experimental What types of experiments were run, and why What tools were necessary to perform these experiments
Materials Titanium Dioxide - Degussa brand, P25 mesh 4-Chlorocatechol - TCI America, recrystallized in heptane 1 and 10 mM KNO3 80 mM NaF 10 mM KCl 1 M HCl
Acid Base Titration Procedure • Into a sample beaker is placed a TiO2 dispersion (800 mL, 1.25 g/L), a pH electrode, a bubbler for Ar sparging, and a tube for acid delivery • Ionic strength is adjusted to 1 mM KNO3 • pH is adjusted to 10 with NaOH, and 0.1 N HNO3 is introduced at 1 mL/min • Once pH reaches 4, the ionic strength is increased, and the titration is repeated
Acid Base Titration Purpose • The titrations were carried out in order to determine the moles of H+ adsorbed onto the P25 at a given pH • This was done by calculating the difference between the moles of H+ required to achieve a given pH in the slurry solution vs. the moles of H+ required to reach the same pH in a blank solution
Fluoride Titration • Into a 1L Teflon beaker is added an 800 mL soln of 1.25 g/L P25 and 10 mM KNO3 • A pH electrode and fluoride electrode are inserted • The pH is adjusted to 5.5 with HNO3 • 80 mM NaF is added at a rate of 233.4 M/h • Fluoride ion adsorbed is calculated by subtracting the solution concentration from the total amount of fluoride added • This provides a measure of the total capacity for adsorption onto the TiO2
Batch Adsorption - Purpose • To determine the amount of CT adsorbed onto TiO2 at a given pH • Multiple runs are done at varying pH so you can monitor how the adsorption of CT is influenced by pH • Can be used as a check for later measurements which will also measure how CT adsorption varies as a function of pH
Batch Adsorption - Procedure • Into a 250 mL three neck RB flask is added 100 mL of 1 g/L TiO2 and 10 mM KCl • Into the necks are inserted a pH electrode, 10 mL burette, and needles for sampling and Ar sparging • Experiments are run at a fixed pH • CT is added as a 1 mL aliquot, allowed to come to equilibrium, filtered, and analyzed with UV/Vis spectrometry
FTIR -ATR Measurements • Stands for “Fourier Transform Infrared - Atenuated Total Reflectance” Spectroscopy • Allows for spectra to be taken of adsorbed species at the catalyst-solution interface to determine what species are present, and in what form • Can be run continuously so that the effects of changing the pH can be analyzed in situ (and can be compared to batch adsorption measurements) • Uses ZnSe crystal coated with 50 L of 53 g/L TiO2
FTIR- ATR Set Up • A Perkin-Elmer FTIR Spectrophotometer was used to collect the data • ATR serves as a modern salt plate for studies of non-traditional spectroscopy experiments
IR Spectra of Adsorbed CT and Change in Adsorbed CT As A Function of pH • IR spectra (A) indicate the same ionic species at all pH’s • Amount of adsorbed species changes with pH • Batch Adsorption also indicates that the amount of CT adsorbed changes with pH, again with max at pH = 8 • Changes are due to altering the speciation of surface TiO2 and H2CT, and changes in surface charge with pH
IR Spectra of H2CT (a), HCT- (b), and CT2- (c) • Deprotonation shifts bands to lower energy • Increased negative charge electrostatically destabilizes the molecule • Disrupts resonance
IR Spectra of CT With Changes in [KCl], and component spectra • Changes in ionic strength affect adsorption of CT • Residuals shown for single Langmuirian site • Spectra of adsorbed CT forms • Indicate multiple forms may exist near surface
Component Spectra Suggest Bidentate Surface Structure of CT • Similarities between component 1 and CT2- suggest a bidentate formation at the surface • Peaks between 1268 and 1484 lie between those of singly and doubly deprotonated spectra. • Indicate a net ionic charge of -1.2
Adsorption of CT as a Function of Total Solution Concentration • Saturation effects before 50 M • Adsorption is directly proportional to solution concentration after 50 M • As solution concentration is increased, there is greater adsorption at lower pH’s - contrary to batch adsorption • Predictive models based upon generalized double layer theory
Mass Law Equations • K’s not given are assumed to be 1 • Using mass law relationships, several models can be tried • Relationships are constrained by adsorption isotherms
Agreement Between Data and Proposed Isotherms • Goodness of fit is indicated by Vy • Fit determined by agreement with data, and a consistent amount of sites as found from proton adsorption
Governing Mass Law and Mole Balance Equations Ti2CT + H2CT CT’Ads (i) H2CT CT’Ads (ii) • (i) Indicates that bound CT increases the affinity for further adsorption • (ii) Indicates that a solution phase CT (H2CT) is adsorbed without changing the concentration of Ti2CT - Nonspecific Adsorption
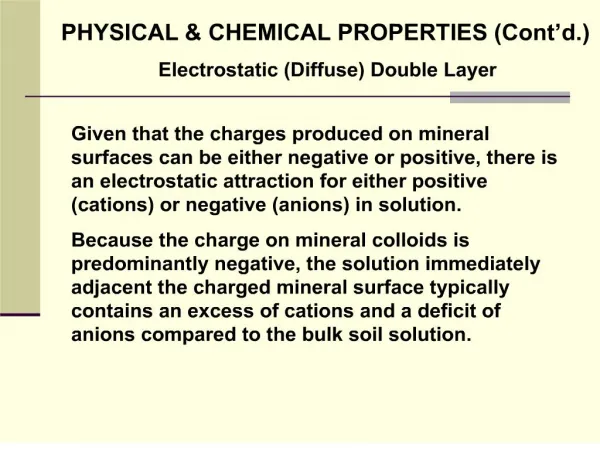
Comments About Double Layer Model • The generalized double layer approach worked adequately at low ionic strengths • It underestimated the surface charge at high ionic strengths and with strongly negative surfaces • The double layer model used here, Gouy Chapman theory, is based upon a flat plane when calculating charge-potential relationships • However, the TiO2 surface structure depends on the local geometry and therefore is highly heterogeneous • Thus, Gouy Chapman gives an averaged value of the structure of TiO2
Conclusions • TiO2 Adsorption is strongly influenced by pH, and its pH history • Most efficient processes are expected to occur near pH 5 • CT adsorbs as a binuclear surface complex monolayer at concentrations less than or equal to 50 M • Above a concentration of 50 M, CT adsorbs nonspecifically as a multilayer complex • Gouy Chapman double layer theory adequately predicts adsorption at low ionic strengths, but fails as ionic strength is increased due to the flat plane assumption
Recognition • Dr. J.F. Gaillard • Stumm and Morgan • Dr. Kimberly Gray