Download
1 / 34
340 likes | 547 Vues
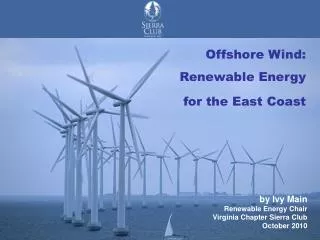
Mid- Atlantic Offshore Wind Power and Fisheries. Prof. Jeremy Firestone Alison Bates University of Delaware College of Earth, Ocean & Environment August 13, 2013. STATE of the World Offshore Wind Industry. Figures and Tables Source: EWEA. Substructures Cumulative. www.theengineer.co.uk.

E N D
Mid-Atlantic Offshore Wind Power and Fisheries Prof. Jeremy Firestone Alison Bates University of Delaware College of Earth, Ocean & Environment August 13, 2013
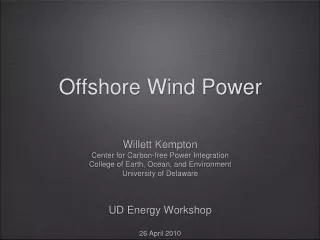
STATE of the World Offshore Wind Industry Figures and Tables Source: EWEA
Substructures Cumulative www.theengineer.co.uk
New Generation Turbines • Siemens 6MW, 154m rotor • Alstom, 6MW, 150m rotor • Areva, 5MW, 135m rotor • Repower, 5MW, 128m rotor • Vestas, 7MW, 164m rotor (planned) • Mitsuhishi, 7MW, 165m rotor (planned)
Spacing Moving toward 8x8 rotor diameters Moving toward 1.2 km to 1.3km between wind turbines (0.65 - 0.7 nautical miles) www.vestas.com
Example offshore system layout from: SørenJuel Petersen, Rambøll Wind Energy (talk at UD, 2 Oct 06)
Offshore wind in the United statesplanning for conflicts and compatibilities
The largest shallow offshore resource in US is in the Mid-Atlantic • 330,000 MW • Average current use: 73,000 MW • Kempton, et al 2007
Mid-Atlantic Offshore Wind Projects • New York (NYPA/LIPA/Con-ed) • up to 700 MW100 turbines, preliminary stage • New Jersey • 1100 MW “Planned” • NJ BPU denies approval of Fishermen’s Energy Demonstration Project • Delaware (Bluewater, 230 MW) • Has federal lease, but long-term power purchase contracts abandoned. • Maryland • Minimum 200MW planned per state legislation • Virginia • Lease sale on September 4, 2013 • Research leases • North Carolina
Offshore Wind Planning Areas • Department of Energy Goals • 10GW by 2020 • 54GW by 2030 • Department of the Interior early planning for wind development • Wind Energy Areas in the Mid-Atlantic
Marine Spatial Planning • More extensively used in Europe to assist in planning for offshore wind projects and other existing ocean uses • National Ocean Policy signed in 2010 • Mid-Atlantic Regional Planning Body • State, Federal & Tribal representatives • Stakeholder input
MSP: How to simply? How to Quantify Tradeoffs? • In an increasingly crowded ocean, where uses evolved organically without regard to other users, how do we put aside our parochial interests, and advance the wider public interest? • Start be examining ways in which we might re-arrange the deck chairs • Examine where there are potentially large gains from “trades,” particularly, where costs are minimal • Easiest is to look at just two uses at a time Samoteskul, et al 2013
Mid-Atlantic Vessel Traffic Densityand potential Wind Energy Areas (Purple) if Ships continue status quo transits
Wind Energy Areas that could be developed if Ships transit further from shore
Cost-Benefit Considerations Commercial Vessel Costs Offshore Wind Power Benefits Lower materials and installation costs & lower debt payments True, even with less power generation per installed MW, leading to more turbines Decreased O&M costs Smaller transmission losses Lower social costs • Greater labor costs • Greater fuel costs • Earlier ship replacement • Greater social costs • (e.g., carbon and SO2 emissions)
Commercial Fishing How to account for commercial fishing as a valuable existing ocean use Look for ways for the two industries to be compatible Evaluate the effects of wind development on both fish species and on fishing as an industry Image: CoonamessettFarm Foundation
Artificial Reefs www.dongenergy.org • Scour protection materials are installed at the base of turbine foundations • Potential for attraction or habitat creation for fish species by adding seafloor complexity • Material selection can in part determine the species assemblages that will be formed • Synthetic Fronds • Gravel Protection • Boulders
Electromagnetic Fields www.futurelab.com • Cables connect between wind turbines and to shore • Electric fields are shielded, magnetic are not • Many fish and crustaceans are sensitive to magnetic fields; elasmobranchs use EM fields for hunting prey • Several species have exhibited behavioral changes in response underwater cables • Altered swimming patterns • Congregation near cable • Avoidance to cross cable
Noise Image: HYDROTECHNIK LÜBECK • Fish use sound for communication, orientation, identification or predators and prey, and to find conspecifics • Noise can be generated during wind farm construction, operation and decommission • Vessels • Pile driving • Blades • Cutting and removal of foundation • Impact depends on many factors • Behavior • Prior exposure • Hearing capability • Stress, altered behavior, avoidance, changes in growth/reproduction, injury, mortality • Noise mitigation measures can reduce the impact on fish
The European Experience Horns Rev (Denmark) – species richness and abundance increased after installation, likely due to more prey availability (Dong Energy, 2006) OWEZ (Netherlands) – overall fish species richness and CPUE were unchanged, although some species showed an increase (e.g. sole, whiting) and others decreased (e.g. lesser weaver) (Lindeboom et al., 2011) Bligh Bank (Belgium) – significant decrease in benthic fish density one year after construction; neighboring Thorntonbanksignificant density differences in only part of project area (Coates & Vincx, 2010) Lillgrund (Sweden) – no major effects on diversity or abundanceof benthic fish communities (Bergtstrom et al., 2013) From a conservation perspective, impact on populations more important than impact on individual fish; long-term, cumulative impacts on fish populations is an ongoing focal point of research (Hawkins, 2011)
Wind/Fisheries Research at UD Identify gear/fishing classifications to look at the industry impacts Quantify the economic impact of conflict areas by assuming levels of ‘de-facto’ exclusion due to gear restrictions or safety Suggest areas for wind development that would be least conflicting both spatially and economically as the MSP process moves forward
Thank you jf@udel.edu abates@udel.edu www.carbonfree.udel.edu www.ocean.udel.edu/windpower