“AIR POLLUTION”
NC STATE UNIVERSITY. U.A.S.L.P. Process Integration for Environmental Control in Engineering Curricula. “AIR POLLUTION”. I. Q. Francisco Gómez Rivera. Universidad Autónoma de San Luis Potosí. Dr. John Heitmann Jr. North Carolina State University. Dr. Pedro Medellín Milán


“AIR POLLUTION”
E N D
Presentation Transcript
NC STATE UNIVERSITY U.A.S.L.P. Process Integration for Environmental Control in Engineering Curricula “AIR POLLUTION” I. Q. Francisco Gómez Rivera Universidad Autónoma de San Luis Potosí Dr. John Heitmann Jr. North Carolina State University Dr. Pedro Medellín Milán Universidad Autónoma de San Luis Potosí January-May 2005
NATURAL RESOURCES POLLUTION INDUSTRIAL PLANTS 6.45 BILLION 9.22 BILLION 2005 2050 TRANSPORTATION U.S. Census Bureau, International Data Base Data updated 4-26-2005 http://www.census.gov/ipc/www/worldpop.html WHY AIR POLLUTION? • CO2: Increasing 5% peryear David T. Allen; David R. Shonnard GREEN ENGINEERING. Environmentally Conscious Design of Chemical Processes Pg: 11-12 destroys precipitates • 1 CFC 10,000 O3 HCl 1 Kg Particles 2 Kg Sulfur dioxide 1 Kg Nitrogen oxides • 1 KWh Coal-burning industrial boiler Richard P. Turco EARTH UNDER SIEGE Pg: 111
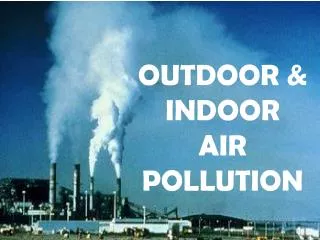
ENERGY PRODUCTION • CHEMICAL PROCESSES • TRANSPORTATION MAIN SOURCES OF AIR POLLUTION COMMON POLLUTANTS • Sulfur oxides • Nitrogen oxide • Carbon monoxide • Hydrocarbons • Particulate Material • Organic compounds • Chlorine and fluorine compounds
QUIZ 5 seconds left 5 seconds left • Main sources of air pollution:(10s) Click To Start • Mention 3 common pollutants of the atmosphere: (10s) Click To Start Time Trial • Percentage that CO2 increases each year: a) 5% b) 10% c) 15% d) 20% R= Energy Production Chemical Processes Transportation R= Sulfur oxides Nitrogen oxides Carbon monoxide Hydrocarbons Organic compounds Particle material Chlorine and fluorine compounds
EMISSIONS • Carbon dioxide • Sulfur oxides • Mercury • Nitrogen oxides WHERE DO THEY COME FROM? Production of fossil fuels Generation of electricity based on geothermal energy Generation of electricity based on fossil fuels Estudio Temático 3: La Electricidad en América del Norte John Paul Moscarella y Edward Hoyt (EIC). Ralph Cavanagh (Consejo para la Defensa de los Recursos Naturales). Dermot Foley (Asociación para el Avance de la Energía Sustentable). Rogelio Ramírez (O, de Ecanal, S.A. de C.V) http://www.cec.org/programs_projects/law_policy/index.cfm?varlan=espanol
PERCENTAGE OF POLLUTANTS RELEASED BY THE PRODUCTION OF ENERGY (1995) • NOx Mexico: 15% United States: 33% = 6.4 millions tons Canada: 10% = 186,000 tons • SO2 Mexico: 48% United States: 70% = 10,519 tons Canada: 22% = 524,000 tons • CO2 Mexico: 25% = 73 millions tons North America = 33% United States: 33% = 17 billions tons Canada: 16.6% = 103 million tons Comisión para la Cooperación Ambiental (1997), Continental Pollutant Pathways: An Agenda for Cooperation to Address Long-Range Transport of Air Pollution in North America (Montreal: CEC).
Fossil Fuels: 66% Mexico: 4% Hydroelectric Energy: 18% United States: 83% Nuclear Energy: 13% Canada: 13% Renewable Energy: less than 2% PRODUCTION OF ELECTRICITY IN NORTH AMERICA CEA, EIA y CFE. • Canada 2% 1% 19% 16% 3% 554.2 Terawatt-hour (1994) 59% CEA. 1997
United States 4% 14% 9% 59% 12% 2% 3% 1% 21% 3,473.6 Terawatt-hour (1994) 53% 14% 8% • Mexico EIA, 1998. 147.9 Terawatt-hour (1994) CFE, 1995.
GROWTH The consumption of electricity is growing. Between 1997 and 2005 the growth in North America has been: • Mexico: 4.5% per year • United States: 1.7% per year • Canada: 1.6% per year OTHER TECHNOLOGIES? In order to supply the new necessities of electricity technologies based in natural gas and hydroelectric energy are the main sources
TECHNOLOGIES EMPLOYED FOR THE NEW DEMAND (1997-2006) • Mexico: New capacity 10,000 MW <1% 1% 2% 5% 10% 82 % CFE, Documento de prospectiva, 1997.
United States: 1% 1% 3% 15% 11% 69% Departamento de Energía de Estados Unidos, EIA. • Canada: 3% 22% 75% 8,212 MW in 2010 CEA, Electric Power in Canada, 1995.
REGULATIONS • Mexico: Permissible emissions for NOx and SOx in point and mobile sources NOM-ECOL-085-1994 NOM-ECOL-086-1994 NOM-ECOL-085-1994 Sources of more than 110,000 MJ/hour MZMC: Metropolitan Zone, Mexico City CZ: Critic Zone. Monterrey, Guadalajara, Ciudad Juarez RC: Rest of the country
United States: The Clean Air Act requires EPA to set National Ambient Air Quality Standards for pollutants considered harmful to public health and the environment. National Ambient Air Quality Standards
QUIZ 5 seconds left 5 seconds left • Name one of the 2 technologies used to meet the new demand:(10s) Click To Start Time Trial • Principal emissions related to energy production :(10s) R= Carbon dioxide Sulfur oxides Nitrogen oxides Mercury Click To Start • Percentage of CO2 generated by energy production in N.A.: a) 20% b) 10% c) 40% d) 30% • Percentage of fossil fuel in the energy production: a) 60% b) 62% c) 64% d) 66% R= Hydroelectric energy Natural Gas
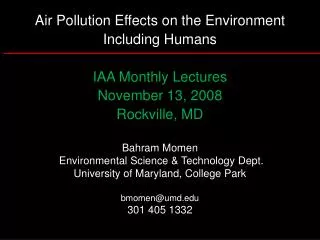
GLOBAL ISSUE? • Air pollutants are not stationary • No borders, cross countries • Some of them can last several years in the atmosphere WHO IS INVOLVED? SOCIETY GOVERMENTS SCIENTISTS INDUSTRY
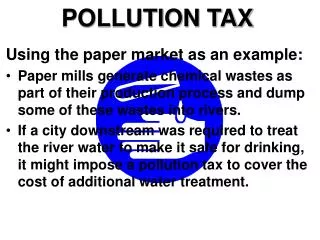
“What to do?” EVOLUTION • Progress = Pollution (past) • End-of-the-pipe (70´s) • Recycle/reuse (80´s) • Plant design (90´s) • Process Integration ??? Atom Production ??? Progress = Pollution Pollution Inevitable result of a chemical process Wastes were released without treatment Bad effects on human health and environment Strict Laws
END-OF-PIPE Reduce/Eliminate Concentration/Toxicity Transfer pollutant from one medium to other Application Pollution increasing • Good results RECYCLE/ REUSE. Plant design Raw materials Atom production High efficiency Good results Pollution decreasing CONTROL vs PREVENTION Treat, reduce or eliminate a pollutant Avoid the creation of pollution
HIERARCHY IN-PROCESS RECYCLE ON-SITE RECYCLE OFF-SITE RECYCLE SOURCE REDUCTION REDUCE / RECYCLE WASTE TREATMENT SAFE DISPOSAL
QUIZ 5 seconds left 5 seconds left 5 seconds left 5 seconds left • What is pollution control?:(10s) • What is pollution prevention?: (10s) • Name the hierarchy pyramid: (10s) Click To Start Click To Start Click To Start Time Trial • Name the “what to do?” evolution:(10s) R= Progress = Pollution End-of-pipe (70’s) Recycle/Reuse (80’s) Process integration??? Plant design (90’s) Click To Start R= Treat, reduce or eliminate a pollutant R= Avoid the creation of pollution R= Source reduction Reduce/recycle: in-process, on-site, off-site Waste treatment Safe disposal
PROCESS INTEGRATION It was developed in the 1970’s Thermodynamic approach (1980’s) Linnhoff Gundersen and Naess Delaby and Smith employed for heat exchanger networks ENERGY INTEGRATION Smith and Petelea Reduction of wastes in a process reduction of the utility demand and a reduction of utility waste Source-Sink Mapping determinates which waste streams can be used as feedstocks to other processes or equipments Optimization Strategies MASS INTEGRATION when the process involves too many sources and sinks it is necessary to employ both mathematical optimization and simulation packages Mass Exchange Network reaches mass integration by a direct exchange between streams
Waste Waste Streams Streams (Lean) (Rich) Out In MASS EXCHANGE NETWORK MSA’s (Lean Streams) In MSA= Mass Separation Agent MASS EXCHANGE NETWORK (to Final Discharge or Recycle to Process Sinks) MSA’s (Rich Streams) Out • Employs either MSA or lean phase yi : solute in the rich phase xj : solute in the lean phase • The MSA must be immiscible • Equilibrium controls the mass transfer: yi = mjxj* + bj • Gradient concentration = Driving force: xj* = (yi – bj)/mj
REGULATIONS COMISSION FOR ENVIRONMENTAL COOPERATION http://www.cec.org/programs_projects/law_policy/index.cfm?varlan=english CANADA: ENVIRONMENT CANADA http://www.ec.gc.ca UNITED STATES: ENVIRONMENTAL PROTECTION AGENCY http://www.epa.com SECRETARIA DEL MEDIO AMBIENTE Y RECURSOS NATURALES MEXICO: http://www.semarnat.gob.mx
REGULATIONS PROTOCOLS Originally signed in 1987. and substantially amended in 1990 and 1992 MONTREAL PROTOCOL Protect the Stratospheric Ozone Layer Chlorofluorocarbons (CFCs), Halons, Carbon Tetrachloride, and Methyl Chloroform http://www.ciesin.org/TG/PI/POLICY/montpro.html RIO DECLARATION Enforcing Adoption of Sustainable Development June 1992. Reaffirming the Declaration of the United Nations Conference on the Human Environment(Stockholm 1972) http://www.unep.org/Documents/?DocumentID=78&ArticleID=1163 OTHERS Managerial procedures for the continuous minimization of pollutants. Enforce the concept of sustainable development ISO 14000 http://www.iso14000.com/
QUIZ 5 seconds left 5 seconds left 5 seconds left 5 seconds left • Protocols that protect the environment:(10s) • Branches of Process Integration: (10s) • Principal driving force on mass exchange: (10s) Click To Start Click To Start Click To Start Time Trial • Governmental Offices in charge of environmental quality • on each country :(10s) Click To Start R= Canada: Environment Canada United States: EPA Mexico: Semarnat R= Montreal Protocol Rio de Janeiro Convention R= Energy Integration Mass Integration R= Gradient of concentration
RECOVERY OF BENZENE FROM GASEOUS EMISSION OF A POLYMER PRODUCTION FACILITY Inhibitors + Special Additives Extending Agent Gaseous Waste R1 S1 Catalytic Solution (S2) Additives Mixing Column (Benzene as primary pollutant) Copolymer (to Coagulation and Finishing) Monomers Mixing Tank Monomers First Stage Reactor Second Stage Reactor Separation Solvent Makeup Recycled Solvent (Benzene) Unreacted Monomers Pollution Prevention Trhough Process Integration Mahmound M. El-Halwagi Pg: 53-62
Gaseous Waste R1 Inhibitors + Special Additives Extending Agent Catalytic Solution (S2) Additives Mixing Column (Benzene as primary pollutant) S1 Copolymer (to Coagulation and Finishing) Monomers First Stage Reactor Monomers Mixing Tank Second Stage Reactor Separation Solvent Makeup Recycled Solvent (Benzene) Unreacted Monomers Additives (Extending Agent, Inhibitors, And Special Additives) Oil Makeup Catalytic Solution Benzene Oil S3 S2 S1 Benzene Recovery MEN To Atmosphere Gaseous Waste R1 Regeneration Copolymer (to Coagulation and Finishing) Monomers Monomers Mixing Tank First Stage Reactor Second Stage Reactor Separation Solvent Makeup Recycled Solvent (Benzene) Unreacted Monomers COMPARISON “Problem” “Possible solution”
POSSIBLE SOLUTION Additives (Extending Agent, Inhibitors, And Special Additives) Oil Makeup Catalytic Solution Oil Benzene S3 S2 S1 Benzene Recovery MEN Gaseous Waste R1 To Atmosphere Regeneration Copolymer (to Coagulation and Finishing) Monomers Mixing Tank First Stage Reactor Second Stage Reactor Separation Monomers Solvent Makeup Recycled Solvent Unreacted Monomers TWO PROCESS MSA´s: S1 and S2 ONE EXTERNAL MSA´s: ORGANIC OIL (S3)
RICH COMPOSITE STREAM Waste Stream R1 3.8 Rich Composite Stream Separation 0..0001 MRi = Gi*(yis – yit) Mass Exchanged = (Gi)*(y) MRi = Gi*(yis – yit) Mass Exchanged = (Gi)*(y)
LEAN COMPOSITE STREAM Inhibitors + Special Additives Extending Agent S1 3.4 S2 2.4 S1 y x1 Catalytic Solution (S2) Additives Mixing Column x2 First Stage Reactor Second Stage Reactor yi = Ljc (xj + ξj) + bj yi = Ljc(xj + ξj) + bj ξj = 0.001 ξj = 0.001 MSi = Ljc(xjt – xjs) MSj = Ljc(xjt – xjs)
LEAN COMPOSITE STREAM 3.4 S2 2.4 S1 3.4 S2 y Lean Composite Stream 2.4 x1 S1 x2 y x1 x2 Superposition of the Streams
PINCH POINT Rich Composite Stream 3.8 3.4 S2 Lean Composite Stream 2.4 S1 y 0..0001 x1 x2 +
PINCH POINT (y,x1,x2) = (0.0010,0.0030,0.0010) Excess Capacity = 1.4 x 10⁻⁴ kgmol B/s Process MSA´s = 2.0 x 10⁻⁴ kgmol B/s External MSA’s = 1.8 x 10⁻⁴ kgmol B/s Lean Composite Stream 5.2 Excess Capacity of Process MSA´s 1.4 x 10⁻⁴ 4.2 3.8 Pinch Point Load to be Removed by External MSA´s Integrated Mass Exchange 1.8 Load to be Removed by External MSA´s 0.0001 y x1 x2
SOLUTION 4.2 3.8 Pinch Point S1 Integrated Mass Exchange Rich Composite Stream 1.8 Load to be Removed by External MSA´s y x1 S1 = L1 (x1out – x1s) L1 = S1 /(x1out – x1s) x1out = 0.0055
SOLUTION Regenerated Solvent, S3 L3=0.0234 Kgmol/s x3s=0.0008 y1t=0.0001 Makeup Regeneration x3out=0.0085 ypinch=0.0010 Additives Mixture, S1 L1=0.08 Kgmol/s x1s=0.0030 Gaseous Waste, R1 G1=0.2 kgmol/s y1s=0.0020 x1out=0.0055 External Process MSA (S3) Pinch Point Flash Separation Internal Process MSA (S1)
ξj ξj MINIMUM ALLOWABLE COMPOSITION DIFFERENCE (ξJ) Practical Feasibility Region yi = mjx*j + bj y x*j = xj + ξj Practical Feasibility Line yi = mj * (xj + ξj) + b Equilibrium Line x*j= (y-bj)/mj xj
(y,x1,x2) = (0.00125,0.0030,0.0015) 5.7 Lean Composite Stream Excess Capacity = 1.9 x 10⁻⁴ kgmol Ben/s Excess Capacity of Process MSAs 4.7 3.8 Process MSA´s = 1.5 x 10⁻⁴ kgmol Ben/s Integrated Mass Exchange 2.3 External MSA’s = 2.3 x 10⁻⁴ kgmol Ben/s Rich Composite Stream Load to be Removed by External MSAs Pinch Point 0.00125 y 0.0001 x1 0.0030 x2 yi = Ljc(xj + ξj) + bj ξj = 0.002 MINIMUN ALLOWABLE COMPOSITION DIFFERENCE (ξJ)
SUMMARY Air pollution is a serious problem which will continue to become more critical in the future due to increasing Population Energy needs Transportation needs Industrial and chemical manufacturing Efforts to reduce and control air pollution have evolved over time, but require further development to meet the increasing need. Currently the best approach may be process integration to optimize plant design to minimize pollutants. “Atom production”, manufacturing with zero waste and byproducts, is a future goal not generally achieve now. Process integration for plant design centers around pinch analysis of mass exchange network (MEN) to minimize waste streams, recycle them in the process, or recover them external to the process.