Download
1 / 37
371 likes | 577 Vues
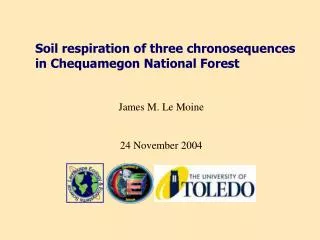
Soil respiration of three chronosequences in Chequamegon National Forest. James M. Le Moine 24 November 2004. Overview. Introduction to soil respiration Soil respiration models Study objectives Study site, respiration measurements Statistics Results Summary of key findings Future work.

E N D
Soil respiration of three chronosequences in Chequamegon National Forest James M. Le Moine 24 November 2004
Overview • Introduction to soil respiration • Soil respiration models • Study objectives • Study site, respiration measurements • Statistics • Results • Summary of key findings • Future work
CO2 • Roots • Fungi • Bacteria • Soil Fauna CO2 Soil Respiration Respiration Food Energy + Waste
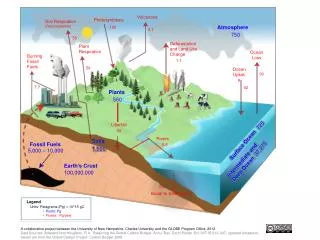
Soil Respiration and the Carbon cycle Soil: 4th largest pool 2nd largest source to atmosphere http://earthobservatory.nasa.gov
Empirical Relations with Microclimate SRR (gCO2 m-2hr-1) Soil Moisture (%) Soil Temperature (oC) • Type of curve fitted depends on data range • SRRt=SRR0*e(q*t) • Q10= change in response for 10 Cº increase in temperature
NEE Established Trends GPP Ra Flux relative to GPP Rh Time Since Disturbance Redrawn from Barnes et al 1980 • Autotrophic and heterotrophic respiration change with maturation. • Soil respiration is comprised of Rh and Ra.
Unanswered Questions Does soil respiration have a trend with maturation? Do different ecosystems have different trends in soil respiration with maturation? Are soil respiration—temperature relationships consistent across maturation classes?
Objectives • Model SRR from temperature in clearcuts and three age classes of hardwood, jack pines, and red pines • Compare SRR, and its temperature sensitivity across forest types, age classes, and age class within forest types. • Correlate SRR and its temperature sensitivity to common, easily obtained, vegetation and soil metrics • Compare the above correlations across forest types, age classes, and age classes within forest types
Study site Chequamegon National Forest • Heavily managed forest • 34—200 m of outwash sands and loamy sands • Growing season— • 120 to 140 days • Precipitation— • 66 to 70 cm rain and 106—150cm snow Figure adapted from Steve Mather
Vegetation Types and Age Classes • Recent Clear Cuts: 1, 2, and 4 years since cut • Mixed hardwoods • 12, 14, 17,19 years 21, 22, 26 years 71, 74, 79 years • Jack Pine Plantations and naturally regenerated • 11,11,13 years 19, 19, 21, 29 years 68, 68, 69 years • Red Pine Plantations • 11,12,14,14 years 23, 24, 24, 31, 32 years 71, 72, 74 years
5 m Soil Respiration Measurements • 8 soil respiration collars • Soil respiration rate • Soil temperature (5cm) • Gravimetric soil moisture • Measurements every 2 wks • mid June—early September ’02 • late April—late October ’03
Statistical Analysis • Shapiro-Wilk (α=0.01)—verification of normality • Nonlinear regression—SRRt=SRR0*e(q*t) • Analyses of Variance (ANOVAs) on SRR0, Q10, SRR15 • Vegetation Type and Age Class(Vegetation) • Vegetation Type • Age Class
Model fits Predicted SRR (g CO2 m-2 h-1) Predicted =0.9408*Actual R2 =0.6776 Actual SRR (g CO2 m-2 h-1) Average model had n=15,SRR0= 0.14, Q10=2.91, R2=0.94
Temperature and Moisture Correlation Spearman=-0.4930, p=0.0001 SRR (g CO2 m-2 h-1) Gravimetric soil moisture (%) Individual plot correlations ranged from -0.59 to -0.80
SRR = 0.0975*e 0.1224*T5 R2 = 0.8783 SRR (gCO2 m-2hr-1) T5 (oC) Temperature Data Range
SRR (gCO2 m-2hr-1) SRR = 0.2093*e 0.0835*T5 R2 = 0.8316 T5 (oC) Temperature Data Range • No data prior to 15 May or post 23 August
Effects on Q10 • Given SRRt=SRR0*e q*t • Q10=e10*q • Q10 all data= e 10*0.1224 • = 3.40 • Q10 parsed= 2.30
Vegetation type and age class Q10 by Age within Vegetation Type • Nested Age not significant • Young and intermediate hardwoods greater than other groups
Q10 by Vegetation Type Q10 by Age Class a a a a • Hardwood SRR is more temperature sensitive than others • There is no consistent age effect on Q10
SRR15 by Age within Vegetation Type Vegetation type and age class • Nested Age not significant • Young and intermediate SRR15 greater than other groups
SRR15 by Vegetation Type SRR15 by Age Class • Hardwood SRR15 is more temperature sensitive than others • There is no consistent age effect on SRR15
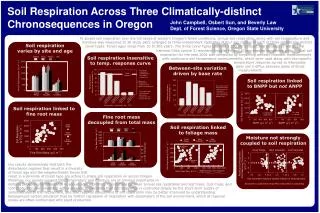
Summary • Temperature alone explains 94% of variation in SRR. Temperature and moisture strongly negatively correlated. • All SRR0 similar. Reflects severe temperature limitation. • Mean Q10 similar to global average of 2.4. As is the range of values (Raich and Schlesinger, 1992) • Considerable variation between replicates. • Statistically only need 1 model for hardwoods and 1 model for all other ecosystems.
Objectives • Model SRR from temperature in clearcuts and three age classes of hardwood, jack pines, and red pines • Compare SRR, and its temperature sensitivity across forest types, age classes, and age class within forest types. • Correlate SRR and its temperature sensitivity to common, easily obtained, vegetation and soil metrics • Compare the above correlations across forest types, age classes, and age classes within forest types
Vegetation and Soils • Age (Ewel, 1987; Field & Fung, 1999; Law et al 2001; Pypker & Fredeen, 2003; and others) • Basal Area (BA) • Foliage Mass (FL) • Canopy Cover (Cover) • Down Woody Debris (CWD, IWD, FWD) Mallik &Hu 2001 • Litter Depth (LD) Euskirchen 2003 • Depth of Organic layer (OD)
LD Ts 10 cm 30 cm SRR LD LD Ms 5 m LD OD 12.5 m Vegetation and Soils
Foliage Mass • H=a*D^b • FL=(c*D^d)*(H^e) • D=diameter at breast height • H=Height • FL=Foliage mass • a, b, c, d, e= species specific coefficients • Crow and Erdman, 1983; Perala & Alban, 1994; Ter-Mikaelian and Korzukhin, 1997; and Young et al. 1980
Linear Correlation • Three steps: • Overall • By Vegetation Type • By Age Class • Pearson correlation for normally distributed data • Spearman correlation for non-normal • Significance = 0.05 • Marginal Significance= 0.05 to 0.10
SRR0 Correlation • Negatively correlated with Q10at all levels • No correlation with vegetation or soil variables
Q10 Correlation with Vegetation • Overall: BA, FL, Cover • Vegetation Type • Hardwood: Cover • Jack Pine: none • Red Pine: -FWD • Age Class • Young: marginal BA • Intermediate: none • Mature: Cover
Q10 Correlation with Soils • Overall: Positive correlation with OD • Vegetation Type • Hardwood: Positive with LD, OD • Jack Pine: none • Red Pine: none • Age Class • Young: none • Intermediate: OD • Mature: none
SRR15 Correlation with Vegetation • Overall: Age, BA, FL, Cover • Vegetation Type • Hardwood: Cover, marginal CWD • Jack Pine: none • Red Pine: Cover, marginally BA • Age Class • Young: BA, FL, Cover • Intermediate: none • Mature: none
SRR15 Correlation with Soils • Overall: LD, OD • Vegetation Type • Hardwood: OD • Jack Pine: none • Red Pine: none • Age Class • Young: LD, OD • Intermediate: none • Mature: OD
Correlation Summary • SRR15 had more correlations with vegetation and soil variables than did Q10 • Canopy cover has most correllates of vegetation variables. Depth of the organic layer is a better correlate than litter depth. • Hardwoods had more correlations than did pines • The young age class had more correlations than did inermediate or mature
Future work • SRR flux source partitioning • SRR as related to stand GPP and NEE • Improve landscape level estimates of CO2 efflux • SRR as related to soil C:N, root abundance, root turnover, and differences in microbial community.