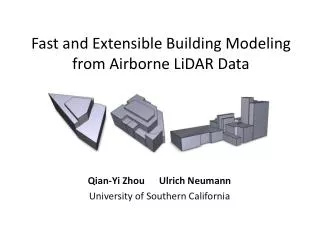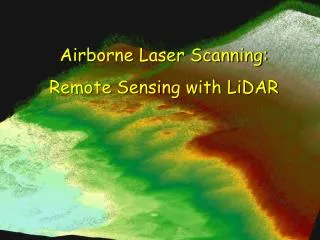
Airborne LIDAR The Technology
Airborne LIDAR The Technology. Frank L.Scarpace Professor Environmental Remote Sensing Center Civil and Environmental Engineering University of Wisconsin-Madison. Slides adapted from a talk given by Mike Renslow - Spencer B. Gross, Inc. PRESENTATION OUTLINE. Background of LIDAR

Airborne LIDAR The Technology
E N D
Presentation Transcript
Airborne LIDARThe Technology Frank L.Scarpace Professor Environmental Remote Sensing Center Civil and Environmental Engineering University of Wisconsin-Madison Slides adapted from a talk given by Mike Renslow - Spencer B. Gross, Inc.
PRESENTATION OUTLINE • Background of LIDAR • Brief Technical Description • Quality Control/Assurance Procedures • LIDAR Data Characteristics • Processing LIDAR Data (2 Steps) • Data Set Characteristics
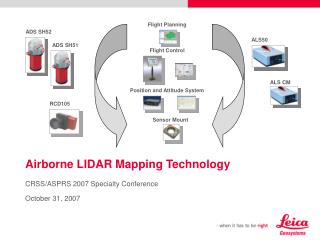
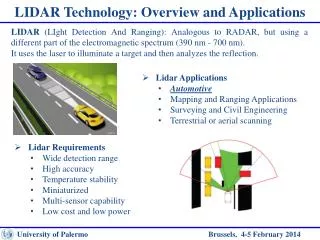
BACKGROUND • LIDAR (Light Detection And Ranging) • 30 Year Old Technology • Became Cost Effective Very Recently • System Components • Laser Scanner, ABGPS, IMU, Precise Clock (Multiple Planes of Reference) • Robust Computer Support • Requires Calibration (Bore Sighting)
BACKGROUND • Capacity to Capture Multiple Return Values / Pulse • Derive many, many X, Y, Z Values • Positional Data and Intensity Data • Multiple Configurations Possible • Remarkably Large Data Files • Accuracy • Standard Deviation 15-20 cm • Vertical RMSE at 20 cm on Discrete ‘Hard Hit’ Points • Horizontal Accuracy at 2X the ‘Footprint” Size
Rotating Mirror Scan Pattern Oscillating Mirror Scan Pattern
LIDAR &Terrain Interaction • For example; a calm still lake, will only reflect energy back within a few degrees of the nadir beam of the laser. • A “wavy” lake on the other hand, will reflect energy back from wider incident angles. • Diffuse surfaces (ground or tree) reflect energy back omnidirectionaly.
Automatic Vegetation Removal • Automatic programs begin the noise and vegetation/surface feature removal process • These remove approximately 80% of vegetation (depending on the land cover and terrain characteristics) • This part typically uses about 20% of the vegetation removal time budget
Trend Surface AnalysisGreen Points = VegetationBrown Points = Trend Surface
Manual Editing • Final vegetation and feature removal requires manual intervention. • Custom selection routines are used in 3D and GIS Software to analyze the data and identify target points. • Accurate interpretation of the LIDAR data requires supporting imagery. • Removal of the remaining 20% of the vegetation and features will account for about 80% of the time budget
LIDAR vs. Traditional Mapping1”=100’ Scale Terrain Mapping Example • Compiled Mass Points are more widely spaced: 60 feet vs. 12 feet. • Compiled DTMs use breaklines; LIDAR usually does not (breaklines can be added from photogrammetric techniques). • Compiler can place points; LIDAR is indiscriminate. • Compiler must be able to SEE THE GROUND, LIDAR is self-illuminating & ‘looks’ down into the vegetation.
DEM and Contour Generation • Contours are a cartographic construct used to visualize topography. • Contours produced directly from the LIDAR TIN are usually not aesthetically pleasing. • LIDAR data can be converted into a DEM Grid at the nominal post spacing which retains fidelity to the original data and which appropriately smoothes the contours.
Conclusions • LIDAR is a powerful new technology for determining terrain elevations. • There are still questions as to the horizontal accuracy. • Appears to be a good companion technology to the existing photogrammetric methods of measuring terrain.