Managing Projects
Managing Projects. Introduction to Project Management. Definition of a Project. A “project” is: a group of related activities performed within a definable time period to meet a specific set of objectives whose value is interdependent. Stephan A Devaux, Total Project Control.


Managing Projects
E N D
Presentation Transcript
Definition of a Project A “project” is: • a group of related activities • performed within a definable time period • to meet a specific set of objectives • whose value is interdependent. Stephan A Devaux, Total Project Control
Definition of a Project Projects are processes: Project Job Shop Batch Assembly Line Continuous Flow
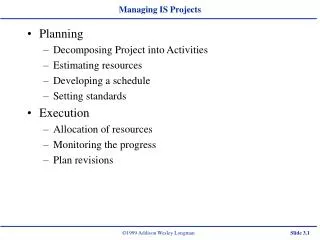
Definition of Project Management Planning, scheduling, and controlling project tasks to meet project objectives on schedule, using the appropriate level of resources.
Project Stages and Gates • Idea generation • Prioritization • Approval • Defining goals • Developing the plan and scheduling • Launching/implementing • Monitoring and controlling • Closing out and evaluating Pre-project Project
Selecting a Project There are usually more possible projects than there are resources. So . . . Prioritizing projects is important. • Resources • Alignment with strategy • Payoff
Selecting a Project • Cost-Benefit Analysis • Scoring/Ranking Models • Management Science Models (maximize profit or minimize risk) • Portfolio Management Approach(diversification) • Sacred Cow
Stages in a Project’s Life Cycle Stage 1 Stage 2 Stage 3 Stage 4 Stage 5 Level of Activity/Costs Time
Project Management Activities • Planning • Task Scheduling • Resource Allocation & Scheduling • Costing • Executing the Plan • Monitoring & Controlling Progress • Closing Out the Project & Improving the Process
The Role of the Project Manager Task responsibilities • Cost • Schedule • Quality • Customer expectations People responsibilities • Communication, • Problem-solving Leadership responsibilities • Motivation • Conflict resolution Organizational responsibilities • Political • Reporting relationships
The Project Team Team characteristics: • Temporary organization • Cross-functional membership • Often matrixed reporting relationships Therefore . . . Defining roles, reporting relationships, and responsibilities for each member is critical!
Team Effectiveness • Appropriate knowledge • Appropriate level for influence within organization • Communication • Meeting effectiveness • Cooperation versus competition • Risk acceptance • Willingness to seek help from each other • Synergy between members • Team member satisfaction
Meeting Effectiveness • Clear goals • For outcomes • For process (agenda) • Appropriate participants • Regular • Ad hoc • Appropriate pre-meeting preparation • Defined member roles
Individual Capability Enhancement Good teams build on strengths of members and build strengths of members! Individual team members should leave team with prior strengths stronger and new capabilities. • Knowledge • Technical skills • Managerial/interpersonal skills
Organizational Performance Enhancement Good team members bring their new capabilities back to their organizations. • To their non-project roles • To new projects
Technical Elements • Work breakdown structure • Budget • Responsibility matrix • Task matrix • Network diagram • Gantt chart
Non-Technical Elements • Motivation • Coaching • Mentoring • Teaming • Conflict resolution • Negotiation • Communication
Project Scope Steering committee: decision-makers, project manager, customer • Project boundaries • Completion target • Resources (broadly) • Performance measures Goal: Agreement among stakeholders
The Detailed Project Plan Work Breakdown Structure 1 Program 2 Project 3 Task 4 Subtask 5 Work Package
The Work Breakdown Structure (WBS) Project Task Task Task Subtask Subtask Subtask Subtask Subtask Subtask Subtask Subtask Subtask Work Package Subtask Subtask
The Project Team • Name activities using a verb + object • Orient activities toward product • Be sure sum of “children” equals the “parent” • Be sure no “parent” has an “only child” • Assign each activity as an integral unit • Break riskier areas into more detail. Stephen A, Devaux, Total Project Control
The Responsibility Matrix Activity Person Responsible Develop script Maxine Plan menu Barb, Julie Recruit volunteers Julie Produce graduation list Barb, Stephanie Produce program Barb, Stepha nie, Pam Communicate with dean’s office Maxine Work with Building and Grounds department Maxine Conduct transcript audits Stephanie, advisors Choose faculty award winner Don Coordinate walk - through Maxine Check diplomas Stephanie, advisors Practice hooding Don Coordinate check - in Barb Conduct post review Maxine
Task Time Estimates Difficult by definition . . . but Risk is reduced if task time estimates • Are done by experienced people • Are based on normal conditions • Are based on efficient methods • Use same units of time • Are independent • Are not contingency-based
However . . . A project team must have a culture that understands that estimates will not all be “accurate” – People can make estimates (and mistakes) without fear.
Task Priority Matrix Room Remodeling Project
Dealing With Uncertainty In reality, task times are hard to pin down to a single point estimate. For complex projects, three estimates are often used: optimistic realistic pessimistic
Task Priority Matrix – Probabilistic Room Remodeling Project
Calculating Probabilistic Task Times The optimistic, realistic and pessimistic times are weighted, . . . often 1:4:1 (realistic or “best” is four times more likely than the others) The expected time for each activity is the sum of the weighted times, divided by the total weight (6). o + 4b + p = time 6 (1)2 + (4)3 + (1)7 = 3.33 6
Managing Tasks: Network Diagrams • Show activities in relation to each other. • Identify the critical path – the longest path through the network. • Show where there is “slack” in the project • Have been drawn historically as • Activity on the arc • Activity on the node A A
Network Diagrams • Activity-on-the-node diagrams • Are most widely used in practice. • Are easier to construct • Are the output of project management software X A A
The Critical Path Method F (7) A (3) D (5) Start B (6) G (4) End C (2) E (2)
Some basic insights in Critical Path Method (CPM) • Forward Pass of the CPM algorithm • The earliest an activity can finish is the earliest time it can start plus its duration • The earliest time an activity can start is the maximum of the earliest finish times of its immediately predecessors • Project completion time is the earliest start of the Finish node • Backward pass of the CPM algorithm • The latest an activity can start is the latest time it can finish minus its duration • The latest an activity can finish is the minimum of the latest start times of all its successors • Slack of an activity is the difference between its latest start time and its earliest start time. • An activity with zero slack is said to be on the critical path
The Critical Path The Critical Path • Is the longest path through the network • Determines overall project duration • Can shift as activity times change – just like a bottleneck!
Slack • Is the amount of time an activity can be delayed without delaying project completion. • Is the “wiggle room” in the network. • Is vitally important for managers, because • Most organizations have more than one project ongoing at any one time. • Resources don’t always have to be used as soon as they can be used.
The Critical Chain Because most organizations have more than one project ongoing at any one time, the real critical factor may not be the critical path of a single project – but rather the intersection of multiple projects at a particular activity (or activities). Eli Goldratt calls this phenomenon the Critical Chain.
Managing Time: Gantt Charts Gantt charts show time, precedence relationships, critical paths, and slack times.
Managing Costs • Normal costs: the costs associated with completing the activity within the normal time, under normal conditions. • Crash costs (or expedited costs): the costs associated with completing the activity in shorter-than-normal time, or crash time (or expedited time). • Crash costs often involve labor overtime and the expenses of the coordination involved in the expediting.
Time/Cost Trade-off Total Costs Indirect/ Penalty Costs Cost Costs of Crashing Time
Quantitative and Qualitative Measures • Quantitative measures • Time • Money • Project conformance • Qualitative measures • Team effectiveness • Individual capability enhancement • Organization performance enhancement
F (7) 3, 5 10, 12 2 2 A (3) D (5) 0, 0 3, 3 3, 3 8, 8 0 0 0 0 Start B (6) G (4) End 0, 2 6, 8 8, 8 12, 12 0 2 2 0 0, 0 0, 0 12, 12 12, 12 C (2) E (2) 4, 8 0, 4 2, 6 2, 6 4 4 4 4 Time Gantt Chart Network Diagram 2, 6
20 15 10 5 0 -5 -10 -15 -20 Today overbudget Time Periods underbudget 0 1 2 3 4 5 6 7 8 9 10 11 12 Reporting Period Time: Actual versus Predicted Variance analysis can also be done for individual activities
Project Cost Breakdown Total $ Total $ Overhead $ Cumulative Dollars ($) Material $ Material $ Labor $ Labor $ Time Time
Costs and Labor Hours 50 50 Customer Service Customer Service 40 40 15 15 Personnel Personnel 10 10 10 10 Finance Finance 15 15 20 20 Overhead Overhead 25 25 5 5 Accounting Accounting 10 10 60 60 40 40 20 20 0 0 0 0 20 20 40 40 Dollars Dollars Hours Hours