Managing Software Projects
Managing Software Projects. The Project Reel J.S “Critical success factors in Software Projects”, IEEE Software, May 1999. Reel’s five step approach for successful projects Start on the right foot


Managing Software Projects
E N D
Presentation Transcript
The ProjectReel J.S “Critical success factors in Software Projects”, IEEE Software, May 1999 • Reel’s five step approach for successful projects • Start on the right foot • Understand the problem, set realistic objectives, build the right team, provide the needed infrastructure • Maintain momentum • Take measures to avoid gradual disintegration • Track progress • Process and project measures to assess progress • Make smart decisions • In terms of resources, make/bu • Conduct a postmortem analysis • Extract lessons learned
To Get to the Essence of a Project - W5HH PrincipleBarry B Bohem, “Anchoring the Software Process” IEEE Software Vol 13 July 1996 • WHY is the system being developed? Validity of business reasons for software work • WHAT will be done? Task set which is required for project • By WHEN? Project schedule • WHO is responsible for a function? Role and responsibility of each member must be defined • WHEREare they organizationally located? All roles don’t reside with in software team
W5HH Principle (cont.) • HOW will the job be done technically and managerially? After scope, strategy is need to be build • HOW MUCH of each resource (e.g., people, software, tools, database) will be needed? Estimates are required
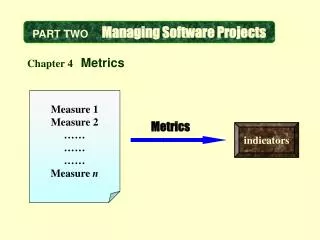
Measures, Metrics and Indicators • Measure (number of errors in component) • Provides quantitative indication of the extent, amount, dimension, capacity or size of some attribute of product or process • Measurement (finding mechanism) • Act of determining a measure • Metric (average number of errors found by one test) • A measure of degree to which a system, component or process possess a given attribute • Indicator (test1 performed better) • Metric(s) that provide insight
Software Qualitymeasurement is essential, if quality is to be achieved • Quality is Conformance to • explicitly stated functional and performance requirements • Explicitly documented development standards • Implicit characteristics – expected of all professionally developed software
Revision Transition Operation McCall’s Quality Factors Maintainability Flexibility Testability Portability Reusability Interoperability Efficiency Correctness Usability Integrity Reliability
Production Operation • Correctness • Extent to which program satisfies specifications and customer’s objectives (defects per KLOC) • Reliability • Extent to which program can be expected to perform its intended function with precision • Usability • Effort required to learn, operate, prepare input for and interpret output • Integrity • Extent of control on unauthorized access • Efficiency • Amount of computing resources required
Product Transition • Portability • Effort required to transfer the program from one hardware/software system environment to another • Reusability • Extent to which a program can be reused in other applications • Interoperability • Effort required to couple one system to another
Product Revision • Maintainability • the ease that a program can be corrected • adapted if the environment changes • enhanced if the customer desires changes in requirements • based on the time-oriented measure mean time to change. • Flexibility • Effort required to modify an operational program • Testability • Effort required to test a program
Product Metrics Single Metric: “IMPOSSIBLE HOLY GRAIL” => No single metrics for Software Complexity
Product Metrics • Evaluation of analysis and design models • Indication of complexity of procedural designs and source code • Facilitate design for effective testing
Metrics for Analysis Model • Functionality Delivered • Indirect measure of functionality that is delivered • System Size • Measures over all size of system (LOC) • Specification Quality • Indication of completeness
Function Based Metricsproposed by Albrecht • Function Point Metric (FP) • Means of measuring the functionality delivered by system • Use historic data to • Estimate cost or effort required to design, code and test • Predict number of errors • Forecast number of components and number of LOC • Derived using empirical relationship based on countable measures of software information domain and assessment of software complexity
Information Domain values • Number of external Input (EIs) • Input originate from user or another application • Number of External Output (EOs) • Provide information to user • Number of external inquiries (EQs) • Input that results in generation of system response • Number of Internal Logic Files (ILFs) • Logical grouping of data that resides within application • Number of External Interface Files (EIFs) • Logical grouping of data that resides external to application
Function Point Calculation Weighting Factor measurement parameter count simple average complex number of user inputs * 3 4 6 = number of user outputs * 4 5 7 = # of user inquiries * 3 4 6 = number of files * 7 10 15 = # of external interfaces * 5 7 10 = count_total
Computing function points Rate each factor on a scale of 0 to 5 0 1 2 3 4 5 no influence incidental moderate average significant essential 1. does the system require reliable backup and recovery? 2. are data communications required? 3. are there distributed processing functions? 4. is performance critical? ........ 14. is the application designed to facilitate change and ease of use by the user? Function Point Calculation
Function-Oriented Metrics FP = count_total * [0.65 + 0.01 * sum of Fi] Outcome: errors per FP defects per FP $ per FP page of documentation per FP FP per person_month
A dataflow Model for SafeHome Software Sensors Test Sensor User Password SafeHome user Interaction Function Zone Setting Zone Inquiry Sensor Inquiry Messages user Panic Button Sensor Status Activate/deactivate Activate/deactivate Monitoring & Response subsystem Alarm Alert Password, sensors… System Configuration data
Information Domain Measures • EI: password, panic button, activate/deactivate • EQ: Zone Inquiry, Sensor Inquiry • ILF: System Configuration File • EO: Messages and Sensor Status • EIF: Test Sensor, Zone Setting, Activate/Deactivate, Alarm Alert
Function Point Calculation Weighting Factor measurement parameter count simple average complex number of user inputs 3 * 3 4 6 = 9 number of user outputs 2 * 4 5 7 = 8 # of user inquiries 2 * 3 4 6 = 6 number of files 1 * 7 10 15 = 7 # of external interfaces 4 * 5 7 10 = 20 count_total 50
Function-Oriented Metrics FP = 50 * [0.65 + 0.01 * 46] = 56 *** 46 is for moderately complex product Outcome: errors per FP defects per FP $ per FP page of documentation per FP FP per person_month
Typical Size-Oriented Metrics • Errors per KLOC • Defects per KLOC • Dollars per KLOC • Pages of documentation per KLOC • Errors per person month • LOC per person month • Dollars per page of documentation
Metrics for Design Model • Architectural Metrics • Component level metrics • Interface design metrics • Specialized OO Design Metrics • CBO (coupling between object classes) • LCOM (lack of Cohesion in Methods)
Metrics for Source Code • Complexity Metrics • Length Metrics
Metrics for Testing • Statement and branch coverage metrics • Defect related metrics • Testing Effectiveness
Project Metrics • Software Project Measures Are Tactical • used by a project manager and a software team • to adapt project work flow and technical activities • The Intent of Project Metrics Is Twofold • to minimize the development schedule • to assess project quality on an ongoing basis • Production Rates • pages of documentation • review hours • function points • delivered source lines • errors uncovered during SW engineering
Software Metrics • Direct measures • Cost and effort applied (in SEing process) • Lines of code(LOC) produced • Execution speed • CPU utilization • Memory size • Defects reported over certain period of time • Indirect Measures • Functionality, quality, complexity, efficiency, reliability, maintainability.
Defect Removal Efficiency Defect removed before shipment as a percentage of total defects DRE = E/(E+D) E – errors found before delivery D – errors found after delivery (within the first year of operation)
Defect Removal EfficiencyJones 1997 Sample size – 1500 projects
Baseline ‘Data colleted from past projects’ • Data must be reasonably accurate • Data should be collected over many projects • Measures must be consistent – same technique or yardstick for data collection • Applications should be similar to work that is to be estimated • Feedback to improve baseline’s quality
Empirical Estimation Models Based upon historic data • Basic Structure E = A + B * (ev)C where A, B, c are empirical constants ‘ev’ is the effort in terms of lines of code or FP ‘E’ is the effort in terms of person months • COCOMO - COnstructive COst MOdel E = 3.2 (KLOC)1.05
Software Project Estimation • Project adjustment components • Problem complexity • Staff experience • Development environment and tools • Factors – human, technical, environmental, political • Estimation is difficult – not an exact science
The Software Equation • It’s a Dynamic Multivariable Estimation Model • Assumes a specific distribution of effort over the life of the software development project • Derived from productivity data collected for over 4000 projects
E = [LOC x B0.333/P]3 x (1/t4) • E – effort in person months or person years • t – project duration in months or years • B – special skill factor • Increases slowly as the need for integration, testing, QA, documentation, management skills grow • P – productivity parameter • Overall process maturity and management practices • The extent to which good SE practices are used • The level of programming language used • The state of the software environment • The skills and experience of the software team • The complexity of the application
Buy versus build • Develop specification for function and performance of the desired software. Define measurable characteristics whenever possible • Estimate internal cost and time to develop • Select 3-4 candidate applications that best meet your specifications • Select reusable software components that will assist in constructing the required application
Buy versus build • Develop comparison matrix that presents a head-to-head comparison of key function. Alternatively, conduct benchmark tests to compare candidate software • Evaluate each software package or component based on past product quality, vendor support, product direction, reputation, etc • Contact other users of the software and ask for opinion
Buy versus build • Delivery date • Development Cost • Acquisition + customization • Maintenance Cost
Cost estimation is one of the issues addressed in Project Plan • Cost estimation is made for • Cost benefit analysis by customer & developer • For bidding purposes • For project control once development begins
Break-down of project cost • Requirements of software, hardware & human resources. • Hardware resource : Computer, terminal time, memory required etc. • Software resource: Tools, Compilers etc. • Human Resources: • Bulk of the cost is due to human resource needed. Cost models focus on that & calculate effort in Person-months.
Uncertainties of Cost Estimation • Cost estimation can be provided at any stage of development life cycle. • Later is more accurate, as we have more information about the final product. • At the beginning a lot of uncertainty exists about the actual specification of the system. • At the beginning stage cost estimates can’t be accurate and can be off by as much as the factor of 4.
Parameters affecting cost • Cost for a project is a function of many parameters • Size of the project • Programmers ability • Experience in the area • Complexity of the project • Reliability Requirements
Software Project Estimation • Purpose • To achieve reliable cost and effort estimates • Delay estimation until late in the project • Base estimates on similar projects that have already been completed. • Use relatively simple decomposition techniques to generate project cost and effort estimates. • Use one or more empirical models for software cost and effort estimation.
Decomposition Techniques • “divide and conquer” approach • Cost and effort estimation done step wise • Empirical estimation models • Complement decomposition techniques • A model based on experience
Decomposition Techniques • Software sizing
Software Sizing • The accuracy of a software project estimate is predicated on • Degree to which the planner has properly estimated the size of the product to be built • Ability to translate the size estimate into human effort, calendar time, and dollars • Degree to which the project plan reflects the abilities of the software team • Stability of product requirements and the environment that supports the software engineering effort.
Cost model requires some knowledge or estimate of some of the parameters, which are then used to predict the cost. COCOMO gives estimates within 20% of actual cost 68% of time. Cost Model
COCOMO • Boehm derived a cost model called COCOMO (Constructive Cost Model) using data from a large set of projects at TRW, a consulting firm based in California (Fenton, 1997). • COCOMO is a relatively straightforward model based on inputs relating to the size of the system and a number of cost drivers that affect productivity. • The original COCOMO model was first published in 1981 (Boehm, 1981). • Boehm and his colleagues have since defined an updated COCOMO, called COCOMO II, that accounts for recent changes in software engineering technology (Fenton, 1997).