Download
1 / 1
10 likes | 119 Vues
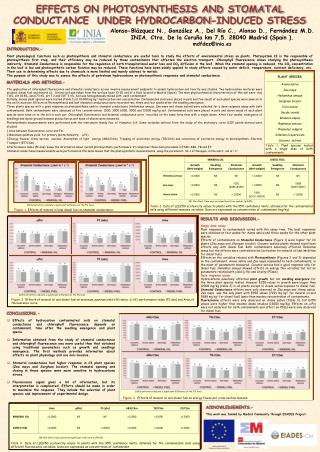
This study evaluates the impacts of petroleum hydrocarbons on plant photosynthesis and stomatal conductance. Employing chlorophyll fluorescence and stomatal conductance as non-invasive measurement techniques, we analyzed the effects of diesel fuel and mineral oil on various plant species. Results indicated that contaminant exposure adversely affects photosynthetic efficiency and stomatal behavior, varying significantly across different species and hydrocarbon types. The findings contribute to understanding the physiological responses of plants to environmental stresses imposed by hydrocarbons, highlighting implications for ecosystem health.

E N D
EFFECTS ON PHOTOSYNTHESIS AND STOMATAL CONDUCTANCE UNDER HYDROCARBON-INDUCED STRESS Alonso-Blázquez N., González A., Del Río C., Alonso D., Fernández M.D. INIA. Ctra. De la Coruña km 7,5. 28040 Madrid (Spain ). mdfdez@inia.es INTRODUCTION.- Plant physiological functions such as photosynthesis and stomatal conductance are useful tools to study the effects of environmental stress on plants. Photosystem II is the responsible of photosynthesis first step, and their efficiency may be reduced by those contaminants that affected the electron transport. Chlorophyll fluorescence allows studying the photosynthesis indirectly. Stomatal Conductance is responsible for the regulation of both transpirational water loss and CO2 diffusion in the leaf. When the stomatal opening is reduced, the CO2 concentration in the leaf is low and photosynthetic carbon fixation may be reduced. These functions have been widely applied to study effects caused by water deficit, temperature, nutrient deficiency, etc. Their use in determining effects due to chemicals is more limited and mainly address to metals. The purpose of this study was to assess the effects of petroleum hydrocarbons on photosynthesis responses and stomatal conductance. UNION EUROPEA FONDO SOCIAL EUROPEO • MATERIALS AND METHODS.- • The application of chlorophyll fluorescence and stomatal conductance as non invasive measurement endpoints to assess hydrocarbon soil toxicity was studied. Two hydrocarbon mixtures were studied: diesel fuel and mineral oil. Control soil was taken from the surface layer (0-20 cm) of a field located in Madrid (Spain). The main physicochemical characteristics of this soil were: clay 7.8%, silt 18.8%, sand 73.4%, pH 7.3 and COT 3.4%. Soil was homogeneously mixed with each contaminant. • Initially, eleven plant species were tested (Table 1) at 10.000 mg kg-1 hydrocarbon soil concentration. Contaminated soils were placed in pots and five seeds of each plant species were sown on to the soil in each pot. Effects on Photosynthesis and leaf stomatal conductance were recorded two, three and four weeks after the seedling emergence. • Three plants species with a good response on photosynthesis and/or stomatal conductance (Helianthus annuus, Zea mays and Avena sativa) were selected for a dose-response assay with both contaminants. Both contaminants were assessed at five concentrations: 1500, 3000 6000, 9000 and 12000 mg/kg soil. Contaminated soils were placed in pots and seven seeds of each plant species were sown on to the soil in each pot. Chlorophyll fluorescence and stomatal conductance were recorded on the same form than with a single doses. After four weeks, emergence of seedlings and above-ground biomass production as wet mass of shoots were measured. • Photosynthesis measurements were performed withthe instrument Handy Pea, of Hansatec S.A. Some variables derived from the study of the stationary curve OJIP points derived were studied: • Area between fluorescence curve and Fm. • Maximum quantum yield for primary photochemistry: j(Po) • Energy fluxes/ Cross section maxima: Absorption of light energy (ABS/CSm), Trapping of excitation energy (TR/CSm) and conversion of excitation energy to photosynthetic Electron Transport (ET/CSm) . • Performance index (PI abs): Gives the information about overall photosynthetic performance. It comprises three main processes in PSII: ABS, TR and ET. • Stomatal conductance measurements were performed on the same leaves that the photosynthetic measurements, using the porometer: SC-1 of Decagon, in the units: µm m-2 s-1. Table 1. Plant species tested with a single dose of both contaminants. NE: No effect. Data were not significant from control. (p>0.05). Table 2. Data of L(E)C50 ecotoxicity values to plants with the 95% confidence limits, obtained for the contaminated soils using different measure variables. Data are expressed as concentration of contaminant (mg/kg). Different letters indicate a significant difference at the 5% level. Figure 1.Effects of mineral oil and diesel fuel on stomatal conductance. RESULTS AND DISCUSSION.- Single dose assay Plant response to contaminants varied with the assay time. The best responses were obtained at four weeks for Avena sativa and three weeks for the other plant species. Effects of contaminants on Stomatal Conductance (Figure 1) were higher for C4 plants (Zea mays and Shorgum bicolor). Cucumis sativus plants showed significant effects only with diesel fuel. Both contaminants adversely affected Heliantus annus but the effects were contradictories (activation for mineral oil and inhibition for diesel fuel). Effects on the variables related with Photosynthesis (Figures 2 and 3) depended on the contaminant. Avena sativa and Zea mays responded to both contaminants, in the most of parameters measured. Cucumis sativus had a good response only for diesel fuel. Heliantus annuus showed effects on energy flux variables but not on parameters related with yield (j Po) and vitality (PIabs). Dose response assay Hydrocarbons adversely affected plant growth but not seedling emergence for the three plant species tested. However EC50 values to growth were bigger than 12000 mg/kg (table 2) in all plants except in Avena sativa exposed to diesel fuel. Stomatal Conductance effects were only observed on Zea mays and Avena sativa. Zea mays was the only plant with EC50 values (7291 mg kg-1 for mineral oil and 5388 mg kg-1 for diesel fuel) lower than maxima concentration of contaminants. Fluorescence effects were only observed on Avena sativa (Table 3), but EC50 values were higher than maxima doses studied (12000 mg/kg). Effects on j(Po) were not observed for both contaminants and effect on PIabs were only observed for diesel fuel. Different letters indicate a significant difference at the 5% level. Figure 2.Effects of mineral oil and diesel fuel on maximum quantum yield efficiency (j Po), performance index (PI abs) and Area of fluorescence curve. • CONCLUSIONS.- • Effects of hydrocarbon contaminated soils on stomatal conductance and chlorophyll fluorescence depends on contaminant, time after the seedling emergence and plant specie. • Information obtained from the study of stomatal conductance and chlorophyll fluorescence was more useful than that obtained using traditional parameters such us growth and seedlings emergence. The first methods provides information about effects on plant physiology and are non-invasive. • Stomatal conductance had higher response in C4 plant species (Zea mays and Sorghum bicolor). The stomatal opening and closing in these species were more sensitive to hydrocarbons stress. • Fluorescence signal gives a lot of information, but its interpretation is complicated. Efforts should be made in order to maximize the response. They include the selection of plant species and improvement of experimental design. Different letters indicate a significant difference at the 5% level Figure 3.Effects of mineral oil and diesel fuel on energy fluxes per cross section maxima. NE. Not effect. Data were not significant from control (P>0.05) ACKNOWLEDGEMENTS.- This work was funded by Madrid Community through EIADES Project Table 3. Data of L(E)C50 ecotoxicity values to plants with the 95% confidence limits, obtained for the contaminated soils using different fluorescence variables. Data are expressed as concentration of contaminant.