Lab6 (Signal & System) Instructor: Anan Osothsilp
130 likes | 272 Vues
This lab instruction provides a comprehensive guide on how to create a simple graphical user interface (GUI) in MATLAB. The objective is to learn how to add interactive elements like figures, text boxes, buttons, and sliders, and how to link these controls with MATLAB functions to handle user interactions. The lab includes video tutorials, coding syntax, and practical examples to help students understand the process involved in GUI development. This is essential for anyone looking to enhance their applications with user-friendly interfaces.

Lab6 (Signal & System) Instructor: Anan Osothsilp
E N D
Presentation Transcript
Date: 20 Feb 07 Lab6 (Signal & System) Instructor: Anan Osothsilp Due Date 09 March 07
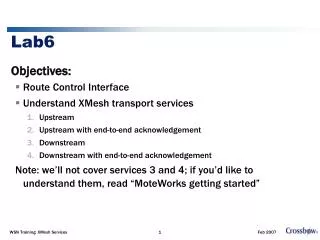
Date: 20 Feb 07 Objective: Learn how to build a simple single-figure dialog to control your application Learn how to add figure, text, button, slider to the figure Learn how to associate Matlab function with event generated by dialog control Anan Osothsilp Page 1 Lab5
Date: 20 Feb 07 Lab Instruction: Follow the video tutorial and do Lab exercises Anan Osothsilp Page 2 Lab5
Date: 20 Feb 07 Parent Example of GUI Figure object Child Child Pushbutton object Fig1 Edit text object control t1 t2 Anan Osothsilp Page 3 Lab5
Date: 20 Feb 07 Anan Osothsilp Page 4 Lab5
Date: 20 Feb 07 Syntax handle = uicontrol(Parent, 'PropertyName',PropertyValue,...) Anan Osothsilp Page 5 Lab5
Date: 20 Feb 07 Button and Textbox Control initialization format Text Box Push Button Format: b1 = uicontrol(Parent, … 'Style',‘pushbutton‘, … 'Position',[X Y Width Height], … 'String', ”label” , … 'CallBack' , ‘functionname’ ); Format: t1 = uicontrol(Parent, … 'Style',‘edit‘, … 'Position',[X Y Width Height],… 'String', ”text” , … 'CallBack‘ , ‘functionname’ ); Example: Example: fig1 = figure(1); t1 = uicontrol(fig1, 'Style','edit', ... 'Position',[45 50 60 20], ... 'String', num2str(25) , ... 'CallBack', 'display('' enter was pressed '')' ); fig1 = figure(1); b1= uicontrol(fig1, 'Style','pushbutton', ... 'Position',[145 50 60 20], ... 'String', 'click me' , ... 'CallBack', 'display(''hello there '')' ); Anan Osothsilp Page 6 Lab5
Date: 20 Feb 07 Example 1: lab61.m %1 figure + 1 push button + 1 text box %Event handler: clicking on push button, it will call function 'display(''hello there '')' %Event handler: press enter on text box, it will call function'display(''enter was hit'') clc; clear; fig1 = figure(1); b1 = uicontrol(fig1, 'Style','pushbutton', ... 'Position',[145 50 60 20], ... 'String', 'click me' , ... 'CallBack', 'display(''hello there '')' ); t1 = uicontrol(fig1, 'Style','edit', ... 'Position',[45 50 60 20], ... 'String', num2str(25) , ... 'CallBack', 'display('' enter key was hit '')' ); Anan Osothsilp Page 7 Lab5
Date: 20 Feb 07 Example 2: lab62.m %calculator clc; clear; fig1 = figure(1); control.b1 = uicontrol(fig1, 'Style','pushbutton', ... 'Position',[345 50 60 20], ... 'String', 'click me' , ... 'CallBack', 'cal(fig1,control)' ); % text1 control.t1 = uicontrol(fig1, 'Style','edit', ... 'Position',[45 50 60 20], ... 'String', num2str(0) , ... 'CallBack', 'cal(fig1,control)' ); % text2 control.t2 = uicontrol(fig1, 'Style','edit', ... 'Position',[145 50 60 20], ... 'String', num2str(0) , ... 'CallBack', 'cal(fig1,control)' ); %text3 control.t3 = uicontrol(fig1, 'Style','edit', ... 'Position',[245 50 60 20], ... 'String', num2str(25) , ... 'CallBack', 'cal(fig1,control)' ); Anan Osothsilp Page 8 Lab5
Date: 20 Feb 07 Example 2: cal.m function cal(fig1,control) num1 = get(control.t1,'String'); %get data from t1 , result is string type num2 = get(control.t2,'String'); %get data from t2 , result is string type temp = str2num(num1) + str2num(num2); %convert string type to number result = num2str(temp); %convert number type to string set(control.t3,'String',result); %set t3 with result To get and set data of control such as text box To get num1 = get(control.t1,'String'); To set set(control.t3,'String',result); String and Integer conversion To convert from string to number a = str2num('10.7'); To convert from number to string b = num2str(20); Anan Osothsilp Page 9 Lab5
Date: 20 Feb 07 Example3: lab63.m clc; clear; fig1 = figure(1); % slider 1 control.s1 = uicontrol(fig1, 'Style','slider', ... 'Position',[145 80 200 20], ... 'Max',100,... 'Min',0, ... 'Value',0,... 'SliderStep',[0.1 0.1],... 'CallBack', 'cal2(fig1,control)' ); %text 1 control.t1 = uicontrol(fig1, 'Style','edit', ... 'Position',[45 80 60 20], ... 'String', num2str(0) , ... 'CallBack', 'cal2(fig1,control)' ); %slider 2 control.s2 = uicontrol(fig1, 'Style','slider', ... 'Position',[145 50 200 20], ... 'Max',100,... 'Min',0, ... 'Value',0,... 'SliderStep',[0.1 0.1],... 'CallBack', 'cal2(fig1,control)' ); % text2 control.t2 = uicontrol(fig1, 'Style','edit', ... 'Position',[45 50 60 20], ... 'String', num2str(0) , ... 'CallBack', 'cal2(fig1,control)' ); %text3 control.t3 = uicontrol(fig1, 'Style','edit', ... 'Position',[45 20 60 20], ... 'String', num2str(25) , ... 'CallBack', 'cal2(fig1,control)' ); Anan Osothsilp Page 10 Lab5
Date: 20 Feb 07 Example 3: cal2.m function cal2(fig1,control) num1 = round(get(control.s1,'Value')); %get value from slider 1 num2 = round(get(control.s2,'Value')); %get value from slider 2 set(control.t1,'String',num2str(num1)); %set data of t1 = num1 set(control.t2,'String',num2str(num2)); %set data of t2 = num2 temp = num1 + num2; result = num2str(temp); set(control.t3,'String',result); %set data of t3 = result Anan Osothsilp Page 11 Lab5
Date: 20 Feb 07 Problem 1 Create Graphical user interface to calculate following task -Get Magnitude input -Get Frequency input -Output = Mangnitude*sin(2*pi*frequency*t); Plot output -create callback function populate.m Magnitude Frequency Anan Osothsilp Page 12 Lab5