Advocating for Financial Equity in Wisconsin School Districts
160 likes | 269 Vues
The Advocacy for Educational Funding (AEF) is a coalition of Wisconsin school districts striving for financial equity in the state’s school finance system. This diverse group includes urban districts like Green Bay and Beloit, as well as rural districts such as Algoma, Cornell, Seneca, and Tigerton. With over 15 years of collaboration, AEF addresses disparities in educational investments and property tax burdens. Key activities include advocating to legislators, proposing solutions for inequities, and disseminating information through newsletters and a dedicated website.

Advocating for Financial Equity in Wisconsin School Districts
E N D
Presentation Transcript
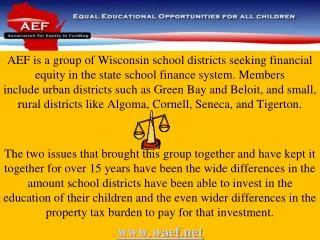
AEF is a group of Wisconsin school districts seeking financial equity in the state school finance system. Members include urban districts such as Green Bay and Beloit, and small, rural districts like Algoma, Cornell, Seneca, and Tigerton. The two issues that brought this group together and have kept it together for over 15 years have been the wide differences in the amount school districts have been able to invest in the education of their children and the even wider differences in the property tax burden to pay for that investment. www.waef.net
AEF Activities Advocating - Meetings (DPI, Legislators, Governor) - Letters – Governor - Resolution Campaign – Levy Credits Newsletters Website: www.waef.net
Updated Legislative Proposal Problem - Inequities Proposed Solutions
School District Comparisons Sources: WTA SchoolFacts10 and October 15, 2010 State Aid Run - DPI
Comparisons between 1992-93 and 2009-10 1996 New $ for 2/3rds = Tax Relief Sources: Basic Facts
State Support for K-12 = Property Tax Relief Property Tax Credits Direct Aid to Schools
Direct Aid v. Levy CreditsImpact on Taxes State Categorical & Equalization Aids affect Gross Tax Levy Certified Tax Levy affects Levy Credits affects Net Property Taxes
Net Property Tax Levy Impact on Pulaski Taxpayers *Based on LFB 2/2/10 analysis that used 08-09 actual school levy credit amount
SCHOOL LEVY & 1st Dollar TAX CREDITS 1995-96 $ 319m1996-97 + 150m Nearly a Decade = $ 469m 2005-06 + 124m $ 593m 2007-08 + 79.4m $ 672.4m 2008-09 + 150m $ 822.4m 2009-10 + 70m $ 892.4m 2010-11 + 4.6m $ 897.0m
State Funding for K-12 Education 2005-06 to 2010-11 ($ in Millions) *This includes First dollar credits that were added in 2008-09 for $75M with another $70M added in 09-10 and $5M in 10-11 Sources: 2009 WISCONSIN Act 28 as vetoed and AEF fall 2009 newsletter
School Levy Credits (Includes school levy credits, first dollar credit, and the lottery and gaming credits) DISTRIBUTION Distributed based on each municipality’s share of statewide levies for school purposes during the preceding three years. Municipality’s 3-Year Average School Levies Statewide 3-Year Average School Levies • Local Factors: • Local Spending (Higher spending means more credit) • Local Levy (Higher taxes means more credit) • Direct State Aid (Lower state aid means higher local levy, means more credit) Source: LFB Papers #21 & #27, January 2009
Differing Effects of the 2 Largest Forms of State Support (Aids v. Credits) on Local Taxes ● Property poor/low spending districts will receive more state support when funds are channeled as Equalization Aid • Property wealthy/high spending districts will receive more state support when funds are channeled as School Levy Tax Credit • Taxpayers in every district gain from First Dollar Credits (Disequalizing) Why is this important? There has been a shift from Equalization Aids to Levy Credits – Disadvantages 70% of WI SDs Source: LFB Analysis February 2, 2010 Memorandum on school aids and school levy tax credits
LFB Analysis: Shift of $747.4M School Levy Credits vs. Equalization Aid to in 2009-10 Source: LFB Paper dated February 2, 2010
CESA Comparisons Source: School Facts ‘10 by WTA
Who Pays & Who Benefits from Levy Credits? • Only 51% of the total school levy credit reduces property taxes of WI homeowners on their primary residences. • 9% of the levy credits go to WI 2nd homeowners • 26% go to non-WI 2nd • "Property owners in the poorest school districts (in terms of property wealth) received an average credit equal to $375 per student. The size of the average credit going to taxpayers in school districts with higher levels of property wealth per student increases with district wealth. Property owners in the state’s 21 property-richest districts received average per student credits of $2,596, nearly seven times the average credit going to taxpayers in the poorest school districts." Source: Andrew Reschovsky's study of the levy credit: http://www.lafollette.wisc.edu/publications/workingpapers/#2010-003
District Comparisons Below Average Credit Above Average Credit Sources: School Facts ‘10 by WTA