
Uploaded by
adeola
4 SLIDES
179 VUES
40LIKES
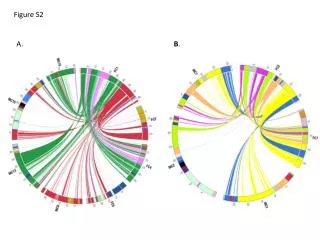
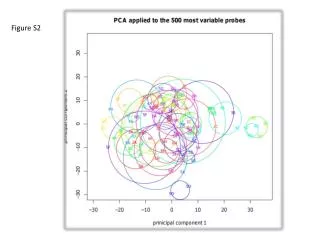
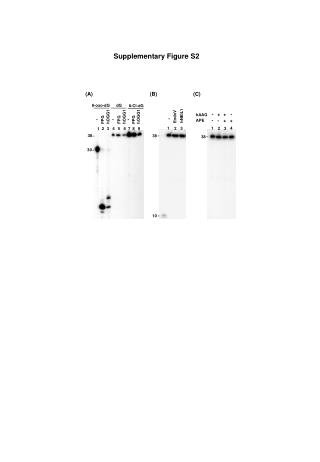
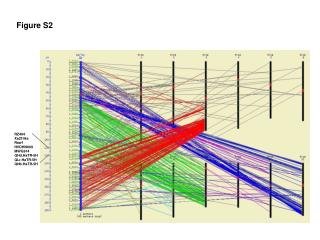
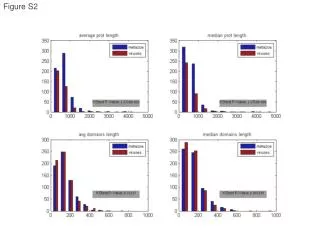
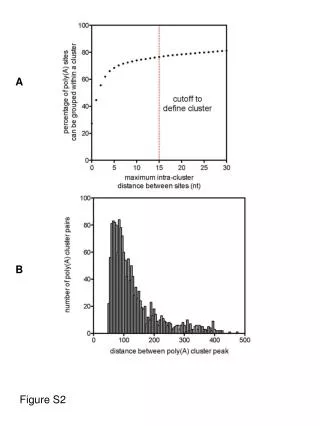
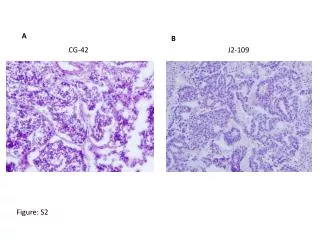
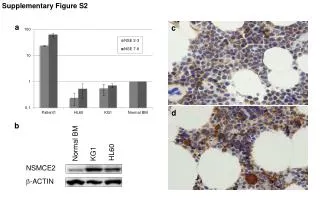
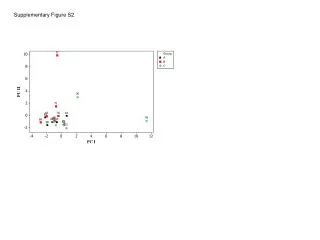
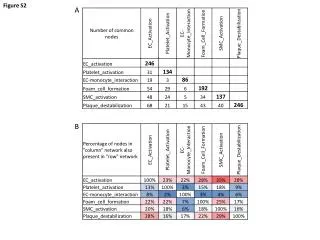
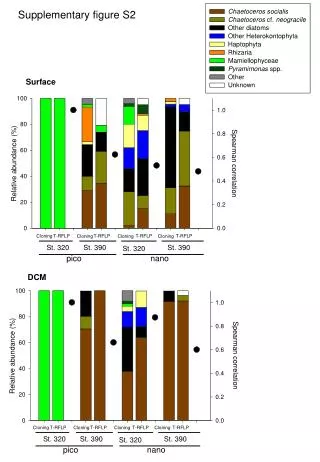
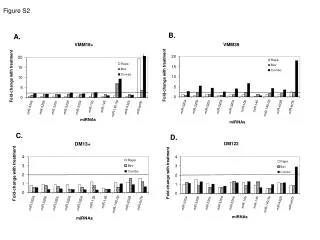
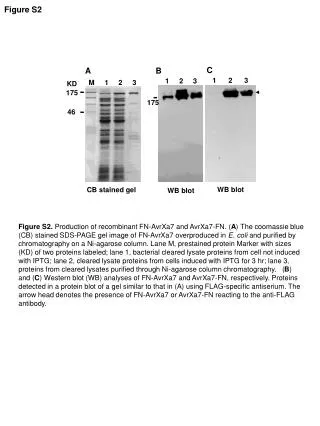
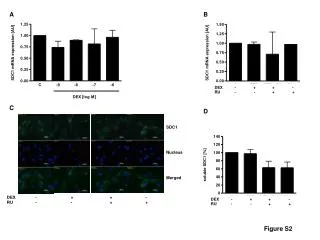
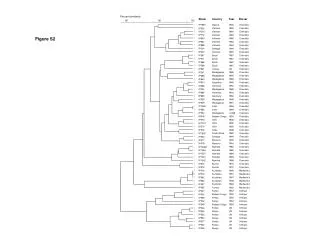
Comprehensive Analysis of Data Representations in Figures S2.A to S2.H
DESCRIPTION
This document presents a detailed overview of the data illustrated in Figures S2.A through S2.H. Each figure uniquely contributes to the overall understanding of the research findings, showcasing various aspects of the experiment. The analysis emphasizes the critical results obtained, the methodologies used, and the interpretations drawn from visual data representations. By examining the figures in sequence, readers can gain insight into the underlying trends and conclusions that emerge from the study, enhancing their comprehension of the subject matter.
Download
1 / 4
Télécharger la présentation 
Comprehensive Analysis of Data Representations in Figures S2.A to S2.H
An Image/Link below is provided (as is) to download presentation
Download Policy: Content on the Website is provided to you AS IS for your information and personal use and may not be sold / licensed / shared on other websites without getting consent from its author.
Content is provided to you AS IS for your information and personal use only.
Download presentation by click this link.
While downloading, if for some reason you are not able to download a presentation, the publisher may have deleted the file from their server.
During download, if you can't get a presentation, the file might be deleted by the publisher.
E N D


More Related