Quantification of Exogenous DNA Using L1-EGFP qPCR Assay
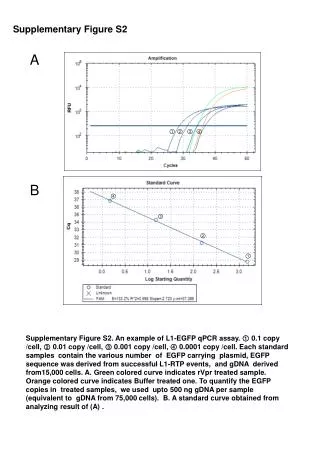
This study presents an example of an L1-EGFP qPCR assay to quantify exogenous DNA copies in treated samples. The assay involves EGFP carrying plasmid standards derived from L1-RTP events, with gDNA from 15,000 cells. Samples treated with rVpr or Buffer are compared, utilizing up to 500ng gDNA/sample. A standard curve analysis is shown to quantify EGFP copies.

Quantification of Exogenous DNA Using L1-EGFP qPCR Assay
E N D
Presentation Transcript
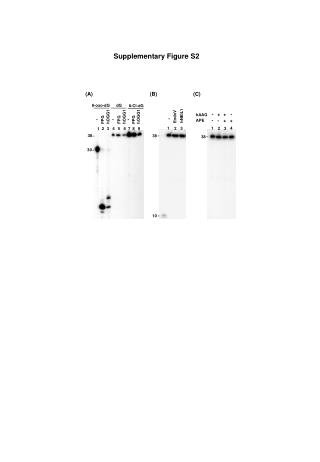
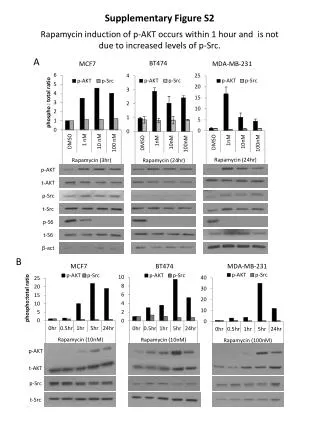
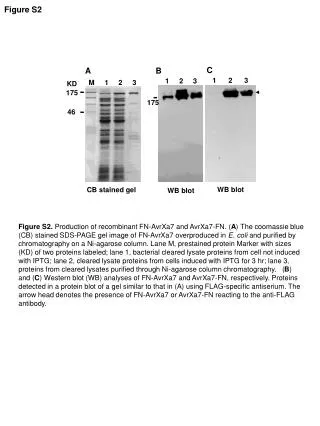
Supplementary Figure S2 A ① ② ③ ④ B ④ ③ Supplementary Figure S2. An example of L1-EGFP qPCR assay. ① 0.1 copy /cell, ② 0.01 copy /cell, ③ 0.001 copy /cell, ④ 0.0001 copy /cell. Each standard samples contain the various number of EGFP carrying plasmid, EGFP sequence was derived from successful L1-RTP events, and gDNA derived from15,000 cells. A. Green colored curve indicates rVpr treated sample. Orange colored curve indicates Buffer treated one. To quantify the EGFP copies in treated samples, we used upto 500 ng gDNA per sample (equivalent to gDNA from 75,000 cells). B. A standard curve obtained from analyzing result of (A) . ② ①