Supplementary Figure S2
Supplementary Figure S2. A. VCX. VCX2. VCX3A. VCX3B. Supplementary Figure S2. B. P < 0.0001. P < 0.0001. P < 0.0001. P < 0.0001. P < 0.0001. P < 0.0001. P = 0.0111. P = 0.0002. P < 0.0001. P < 0.0001. P < 0.0001. P < 0.0001. AdenoCa. AdenoCa. AdenoCa. AdenoCa. AdenoCa.
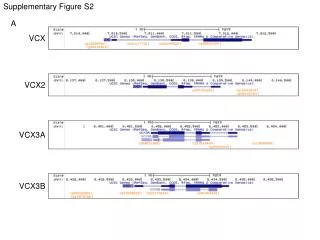

Supplementary Figure S2
E N D
Presentation Transcript
Supplementary Figure S2 A VCX VCX2 VCX3A VCX3B
Supplementary Figure S2 B P < 0.0001 P < 0.0001 P < 0.0001 P < 0.0001 P < 0.0001 P < 0.0001 P = 0.0111 P = 0.0002 P < 0.0001 P < 0.0001 P < 0.0001 P < 0.0001 AdenoCa AdenoCa AdenoCa AdenoCa AdenoCa AdenoCa SCC SCC SCC SCC SCC SCC N N N N N N N N N N N N T T T T T T T T T T T T Methylation levels of CpG sites for VCX/Y genes. A. Schematic diagrams for VCX, VCX2, VCX3A, and VCX3B genes and CpG sites from UCSC Genome Bioinformatics (http://genome.ucsc.edu/). B. Methylation levels in CpG sites of VCX, VCX3A and VCX3B. AdenoCa; adenocarcinoma, SCC; squamous cell carcinoma, N; normal tissue, T; tumor tissue. P values were calculated by Mann–Whitney U test.