Download
1 / 1
10 likes | 93 Vues
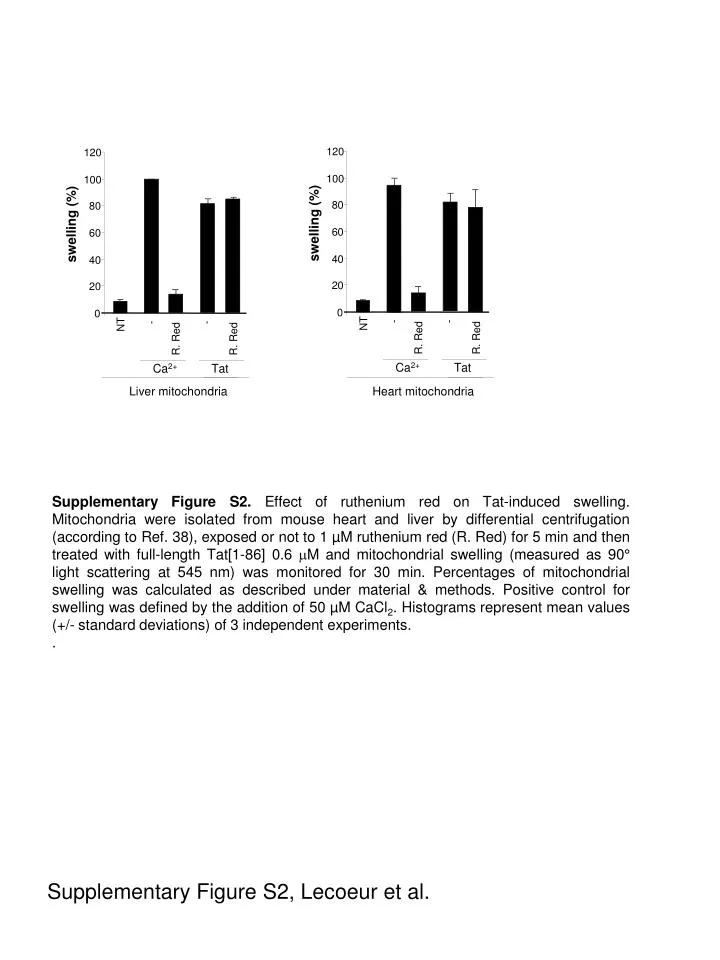
120. 120. 100. 100. 80. 80. swelling (%). swelling (%). 60. 60. 40. 40. 20. 20. 0. 0. -. -. -. -. NT. NT. R. Red. R. Red. R. Red. R. Red. Ca 2+. Tat. Ca 2+. Tat. Heart mitochondria. Liver mitochondria.

E N D
120 120 100 100 80 80 swelling (%) swelling (%) 60 60 40 40 20 20 0 0 - - - - NT NT R. Red R. Red R. Red R. Red Ca2+ Tat Ca2+ Tat Heart mitochondria Liver mitochondria Supplementary Figure S2. Effect of ruthenium red on Tat-induced swelling. Mitochondria were isolated from mouse heart and liver by differential centrifugation (according to Ref. 38), exposed or not to 1 µM ruthenium red (R. Red) for 5 min and then treated with full-length Tat[1-86] 0.6 M and mitochondrial swelling (measured as 90° light scattering at 545 nm) was monitored for 30 min. Percentages of mitochondrial swelling was calculated as described under material & methods. Positive control for swelling was defined by the addition of 50 µM CaCl2. Histograms represent mean values (+/- standard deviations) of 3 independent experiments. . Supplementary Figure S2, Lecoeur et al.