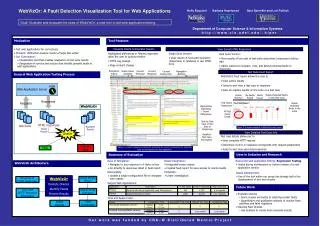
Visualization for Fault Localization
Visualization for Fault Localization. James A. Jones, Mary Jean Harrold, John T. Stasko Georgia Institute of Technology. Supported by Boeing Commercial Airplane Group, National Science Foundation, and the Yamacraw Project. Motivation. Improve software quality


Visualization for Fault Localization
E N D
Presentation Transcript
Visualization forFault Localization James A. Jones, Mary Jean Harrold, John T. Stasko Georgia Institute of Technology Supported by Boeing Commercial Airplane Group, National Science Foundation, and the Yamacraw Project
Motivation • Improve software quality • Reduce the number of delivered faults • Locate faults after failures (debugging) • Reduce the time and cost necessary to debug
Outline • Approaches • Discrete • Continuous • Tarantula • Demo • Preliminary Evaluation • Open Questions
Discrete Approach • Input • Source code • For each test case • its pass/fail status • statements that it executes • Display statements in program according to the test cases that execute them Both passed & failed test cases Only passed test cases Only failed test cases Statements executed by:
Example Test Cases mid() { int x,y,z,m; 1: read(“Enter 3 numbers:”,x,y,z); 2: m = z; 3: if (y<z) 4: if (x<y) 5: m = y; 6: else if (x<z) 7: m = y; 8: else 9: if (x>y) 10: m = y; 11: else if (x>z) 12: m = x; 13: print(“Middle number is:”, m); } 5,3,4 3,3,5 1,2,3 3,2,1 5,5,5 2,1,3 Pass Status: P P P P P F
Example Test Cases mid() { int x,y,z,m; 1: read(“Enter 3 numbers:”,x,y,z); 2: m = z; 3: if (y<z) 4:if (x<y) 5:m = y; 6:else if (x<z) 7:m = y; 8:else 9:if (x>y) 10:m = y; 11: else if (x>z) 12: m = x; 13:print(“Middle number is:”, m); } 5,3,4 3,3,5 1,2,3 3,2,1 5,5,5 2,1,3 Pass Status: P P P P P F
Continuous Approach • Distribute statements executed by both passed and failed test cases over spectrum • Indicate the relative success rate of each statement by its hue Both passed & failed test cases Only passed test cases Only failed test cases Discrete Approach: Continuous Approach:
Hue • If a statement is executed by 10 failed test cases and 20 passed test cases, it would be colored mostly green 10 failed test cases = 100% 10 m = y; • However, if the test suite contains 10 failed test cases and 200 passed test cases, it would be colored mostly red 20 passed test cases = 10 % 200
Hue 10 failed test cases = 100% 10 a = b; 10 failed test cases = 100% 0 passed test cases = 0% 10 10 m = y; 1 failed test cases = 10% 20 passed test cases = 10 % 10 200 c = d; 0 passed test cases = 0% 10
Brightness 10 failed test cases = 100% 10 m = y; 10 failed test cases = 100% 0 passed test cases = 0% 10 10 m = y; 1 failed test cases = 10% 20 passed test cases = 10 % 10 200 m = y; 0 passed test cases = 0% 10
Brightness • Using total percentage of test cases that execute a statement may cause important statements to be overlooked 10 failed test cases = 100% 10 m = y; 20 passed test cases = 10 % 200 • Instead we use the higher of the two independent percentages 30 total test cases = 14% 210
Example Test Cases mid() { int x,y,z,m; 1: read(“Enter 3 numbers:”,x,y,z); 2: m = z; 3: if (y<z) 4:if (x<y) 5:m = y; 6:else if (x<z) 7:m = y; 8:else 9:if (x>y) 10:m = y; 11: else if (x>z) 12: m = x; 13:print(“Middle number is:”, m); } 5,3,4 3,3,5 1,2,3 3,2,1 5,5,5 2,1,3 Pass Status: P P P P P F
Scalability } • Large programs difficult to display • Use the line-of-pixels, SeeSoft, view • Each character in the source is displayed as a pixel mid() { int x,y,z,m; read(“Enter 3 numbers:”,x,y,z); m = z; if (y<z) if (x<y) m = y; else if (x<z) m = y; else if (x>y) m = y; else if (x>z) m = x; print(“Middle number is:”, m); } [Eick,Steffen,Sumner, TSE 1992]
Preliminary Evaluation • Two preliminary studies • How red are the faulty statements? • How red are the non-faulty statements? • Subject program: Space • 8000 lines of executable code • 1000 coverage-based test suites of size 156-4700 test cases • 20 faulty versions
Open Questions • Are the faults typically colored red? • If there are faults that are not colored red, why and what are they? • Are non-faulty red statements near the fault? • What other views and analyses would be useful? • What is the maximum practical number of faults for which this technique works?