Download
1 / 1
10 likes | 141 Vues
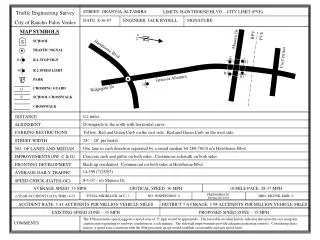
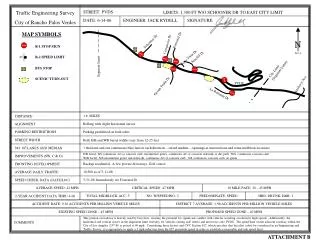
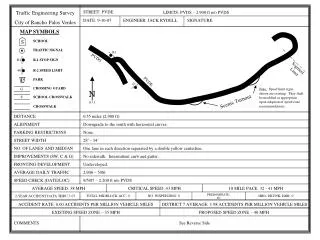
N. n.t.s. 40. 40. Segment Limit. 40. 40. 45. STOP. STOP. STOP. STREET: PVDS. Traffic Engineering Survey City of Rancho Palos Verdes. LIMITS: 1,500 FT E/O SEACOVE DR TO 1,300 FT W/O SCHOONER DR. DATE: 6-14-06. ENGINEER: JACK RYDELL. SIGNATURE:. MAP SYMBOLS. Narcissa Dr.

E N D
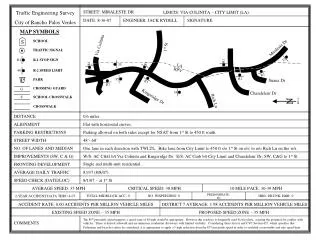
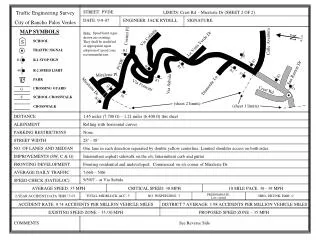
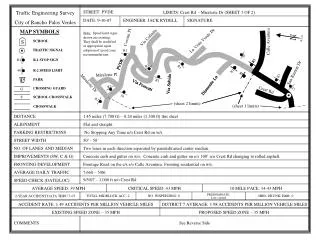
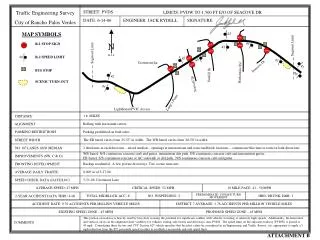
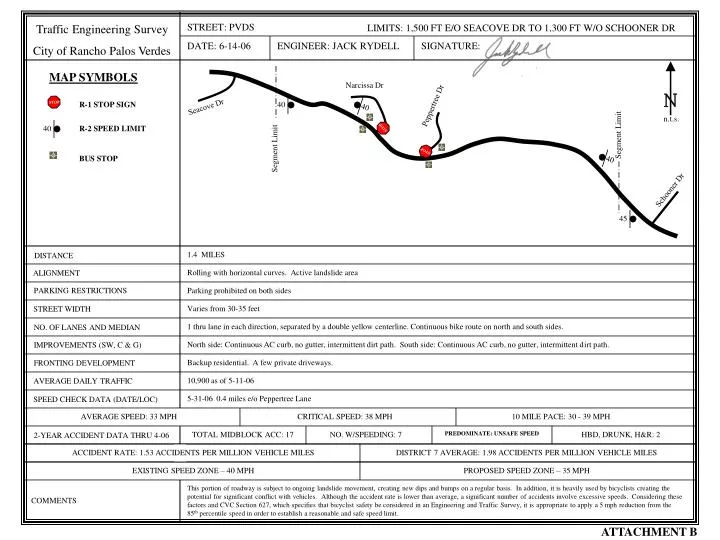
N n.t.s. 40 40 Segment Limit 40 40 45 STOP STOP STOP STREET: PVDS Traffic Engineering Survey City of Rancho Palos Verdes LIMITS: 1,500 FT E/O SEACOVE DR TO 1,300 FT W/O SCHOONER DR DATE: 6-14-06 ENGINEER: JACK RYDELL SIGNATURE: MAP SYMBOLS Narcissa Dr R-1 STOP SIGN Peppertree Dr Seacove Dr R-2 SPEED LIMIT Segment Limit BUS STOP Schooner Dr 1.4 MILES DISTANCE Rolling with horizontal curves. Active landslide area ALIGNMENT PARKING RESTRICTIONS Parking prohibited on both sides Varies from 30-35 feet STREET WIDTH 1 thru lane in each direction, separated by a double yellow centerline. Continuous bike route on north and south sides. NO. OF LANES AND MEDIAN North side: Continuous AC curb, no gutter, intermittent dirt path. South side: Continuous AC curb, no gutter, intermittent dirt path. IMPROVEMENTS (SW, C & G) Backup residential. A few private driveways. FRONTING DEVELOPMENT 10,900 as of 5-11-06 AVERAGE DAILY TRAFFIC 5-31-06 0.4 miles e/o Peppertree Lane SPEED CHECK DATA (DATE/LOC) AVERAGE SPEED: 33 MPH CRITICAL SPEED: 38 MPH 10 MILE PACE: 30 - 39 MPH TOTAL MIDBLOCK ACC: 17 NO. W/SPEEDING: 7 PREDOMINATE: UNSAFE SPEED HBD, DRUNK, H&R: 2 2-YEAR ACCIDENT DATA THRU 4-06 ACCIDENT RATE: 1.53 ACCIDENTS PER MILLION VEHICLE MILES DISTRICT 7 AVERAGE: 1.98 ACCIDENTS PER MILLION VEHICLE MILES EXISTING SPEED ZONE – 40 MPH PROPOSED SPEED ZONE – 35 MPH This portion of roadway is subject to ongoing landslide movement, creating new dips and bumps on a regular basis. In addition, it is heavily used by bicyclists creating the potential for significant conflict with vehicles. Although the accident rate is lower than average, a significant number of accidents involve excessive speeds. Considering these factors and CVC Section 627, which specifies that bicyclist safety be considered in an Engineering and Traffic Survey, it is appropriate to apply a 5 mph reduction from the 85th percentile speed in order to establish a reasonable and safe speed limit. COMMENTS ATTACHMENT B