Cohort studies
Cohort studies. Design Concepts in Nutritional Epidemiology Barrie M. Margetts and Michael Nelson. Contents General considerations Practical issues Infancy and childhood Adults The elderly Concluding remarks Appendix Checklist for planning a cohort study Analysis of cohort studies.


Cohort studies
E N D
Presentation Transcript
Cohort studies Design Concepts in Nutritional Epidemiology Barrie M. Margetts and Michael Nelson
Contents • General considerations • Practical issues • Infancy and childhood • Adults • The elderly • Concluding remarks Appendix • Checklist for planning a cohort study • Analysis of cohort studies
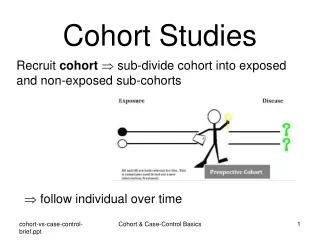
General considerations • A cohort : • A group of persons, identified at one point in time, who march off together into the future under the watchful eye of an investigator. • A cohort study: • A group of persons is defined, certain characteristics about each individual are recorded, and they are then followed up in such a way that new events (such as disease and death) or other changes in their characteristics are detected. • These new events and changes can then be related to the original observations in order to discover what aspects of the initial status of the subjects predict their subsequent experience.
Two main types of cohort study : • Prospective (more usual type) --baseline information is collected when subjects enter the study and they are followed up over its duration • Retrospective --- a 'historical cohort' is identified with reference to some point in the past --- This approach is possible only where adequate records exist; it has the advantage that the effects of a long period of time can be observed during a relatively short period of study.
The use of the cohort study : • In the elucidation of aetiology. • In studying the natural history of a disease, and how this is modified by treatment.
Reasons for preferring the cohort type of study to the case-control approach: • It enables the investigator to obtain accurate information about the individuals before the onset of the disease being investigated. • Information obtained prospectively is not only more accurate but is also less open to bias than that obtained retrospectively, when the outcome is known. • It allows us to detect unexpected effects of the initial factors,whereas a case-control analysis is restricted to the selected condition. • The findings show the strength of an association in public health terms, so that the 'population attributable risk' can be calculated.
The disadvantages of the cohort study • Prospective aetiological studies are inevitably large, long, and expensive, even for the more common diseases, and not usually feasible for less common diseases. • It may happen that the subjects alter their eating habits, either spontaneously or as a result of changes in dietary fashion, to such an extent that the original observations are irrelevant. • The difficulties of tracing all the subjects, unforeseen changes in the personnel involved in the study, and the ultimate hazard that the hypothesis being tested becomes superseded, so that the investigator finds that the wrong baseline.information has been recorded.
Occasionally, a 'nested' design is used, combining the cohort and case-control approaches. The sensitivity of the comparison is not much less than it would be if the specimens from all the subjects were used, and theexpense of analysis is greatly reduced.The advantages of the cohort methods are thus retained, together with the greater efficiency of the case-control design. Ex.: If a large cohort is being followed up, and a sample of every member's serum as been stored, a case-control analysis can be made within the cohort at a later date. Persons who acquire a given disease are identified, and controls (usually two or three per case) are selected from the cohort, each control being matched with a case in respect of age and gender. The sera of cases and controls are extracted and appropriate biochemical analyses are made.
Practical issues • To obtain expert statistical advice at the planning stage so as to ensure that the study is likely to be large and long enough but not greatly in excess of the requirements. • Calculations of size and duration will be based on the expected numbers of endpoints in the study (see appendix 14.1). • Suitable forms are designed on which information can be collected and coded for easy computerization. • To conduct a short pilot study to test the procedures that will be used in the survey. • Information can be obtained from a sub-sample and will provide some estimate of the stability of the original measurements in the group being studied.
Practical issues • To acquire information during the whole of the follow-up period, contact will then have to be made with the subject periodically, either by visiting or by telephone. If day-to-day information is required (e.g. on infant feeding methods) a diary may be used. • Some of the subjects will have moved or died, and information may not be easily obtained, particularly in a free-living population. Plans should be made at the start of the study about how the subjects will be traced. • It may be advisable to have periodic contact with all the subjects (say at annual intervals), by telephone or reply-paid cards, simply in order to detect those who have left the area.
Another way of minimizing the difficulties of finding subjects is to select them from certain occupations whose members are particularly easy to trace. • Ex. Medical practitioners ,Civil Servants • The main drawback of these groups is that they do not entirely represent the population at large, but are drawn from specific social classes. Furthermore, people who are employed or who volunteer always tend to be healthier than others of their age-group , so that the cohort may need to be larger. And the results may not apply exactly to the wider population. • If the intention is to look for changes in biochemical variates (e.g. serum cholesterol), the study should be discussed with the biochemist at the start so as to avoid a change in laboratory methodology, which will invalidate comparisons.
Changes in staff or collaborators may be more difficult to foresee and can have a disastrous effect if the newcomer does not have the same degree of interest or commitment as the person with whom the study was set up. • If the final measurements (e.g. of blood pressure) are to be made by someone other than the person who made the initial measurements, attention should be paid to standardization and comparability. • It may also be desirable for the person recording the final measurements or endpoints to be unaware of the initial data, so as to avoid bias.
Infancy and childhood • Infancy provides perhaps the best possible opportunity for cohort studies. • A cohort of babies can easily be defined in terms of place and time of birth. Some information (e.g. regarding birthweight and initial mode of feeding) is collected routinely and can be supplemented with other details as required.The duration of such studies can in principle be extended indefinitely; even the longevity of the original investigator need not be a limitation! Large national birth cohorts: • The National Survey of Health and Development, the National Development Study, and the Child Health and Education Study • It is clear that early influences have long-term predictive effects. It is difficult to rule out potential confounding variables (e.g. long-acting adverse environmental factors or genetic influences.
Adults • Cohort studies in adults have been very useful in elucidating the role of diet in the causation of disease. Nutrition is a major determinant of health, so it is obviously important to investigate its influence on morbidity and mortality. Everybody eats food, but not necessarily the same food, so there are ample opportunities for comparing the effects of different dietary habits within the same population. Ischaemic heart disease (IHD) is a good example of a relationship between diet and health, and has been investigated in this way. Table 14.1 summarizes nine cohort studies that have reported associations between diet and heart disease.
Cohort studies have yielded useful information about nutritional factors in relation to other common diseases: • --The Framingham study indicated a protective effect of fruit and vegetables against stroke. • --Breast cancer has been positively associated with alcohol intake and negatively with vitamin A. • --In the Prospective Basel Study, plasma anti-oxidants (carotene and vitamins A, C, and E) were measured in 2974 Swiss men; in the following 12 years, lung cancer was associated with initially low plasma carotene and stomach cancer with low vitamin C and lipid-adjusted vitamin A levels.
The elderly • Reasons for expecting cohort studies to be particularly easy and fruitful in the elderly : • --- The diet of an old person is likely to be more uniform. • --- Nutritional deficiency is more common in old age than at other • periods of life, yet many elderly people eat very well. The dietary • variation between individuals is therefore large in comparison • with the variation within individuals . • --- Morbidity and mortality are very high in the elderly, so more • endpoints will occur per person-year of follow-up than at younger • ages.
The confounding effect of differential ageing is particularly important in old age,and is well illustrated by the paradoxical finding that obesity is a favourable prognostic index in the elderly. Over the age of 65, people tend on average to lose weight as they grow older. But not everybody ages at the same rate. Some tend to be leaner and to die earlier, while those who arebiologically young for their chronological age are on average fatter and less likely to die in the next few years. But it does not necessarily follow that thin old people would live longer if they managed to put on weight.
Cohort studies allow more rigorous testing of aetiological hypotheses than other observational studies. • They also provide unique information about the natural history of disease. • Their disadvantages firstly concern feasibility, because they tend to be large,long, and suitable only for the study of common diseases. Secondly, they share other weaknesses of the observational approach, in that subjects who choose to eat one type of diet probably differ from people who eat a different diet in other ways that could affect their risk of disease. This confounding is particularly important when the nutritional variables are likely to be associated with particular lifestyles or the initial state of health and senescence of the subjects. • Insofar as it is not possible to conduct long-term, randomized controlled trails of dietary changes in free-living populations,cohort studies provide the best available evidence of aetiology. Conclusion remarks
Appendix I: Checklist for planning a cohort study 1. Purpose of the study 2. Value of the study 3. Definition of the cohort 4. Numbers 5. Recruitment of the subjects 6. Baseline data 7. Tracing of subjects 8. Collection of follow-up data 9. Analysis of data 10. General considerations
1. Purpose of the study (a) What hypotheses will the study examine? (b) What other specific questions will it address? 2. Value of the study (a) If the hypotheses are confirmed, will we be any better off ? (e.g. in our ability to understand disease or treat patients) (b) If the hypotheses are not confirmed, will other scientists be interested?
3. Definition of the cohort (a) Is the cohort to be identified retrospectively or prospectively? (b) What are the inclusion criteria (age, gender, area of residence, etc.)? (c) What exclusion criteria apply ? (e.g. presence of certain diseases, residence in institutions) (d) If the cohort is recruited over a period of time, at what point do the subjects have to meet the age and other criteria (e.g. at the start of the study, or when the subjects are seen)? (e) Are there any ambiguities in the way the criteria are defined or recorded? (f) Will the cohort comprise a total population defined as above, or will it be a sample of the population, and, if so, how will the sample be selected ? (e.g. randomly or by volunteering)
4.Numbers (a) How large will the cohort be and how has its size been calculated (expected differences, statistical power,etc.)? (b) What allowances have been made for non-response and migration of subjects? 5. Recruitment of the subjects (a) How will the subjects be identified? (b) How accurate and up-to-date is the sampling? (c) Over what period will recruitment continue? (d) Can we foresee any biases arising during recruitment ? (e.g. from selective identification or response of subjects)
6. Baseline data (a) What data are to be collected at baseline (including potential aetiological factors and possible confounders)? (b) What checks could be conducted on reproducibility, validity, comprehensibility of questionnaires, etc., so that the findings will be accepted as true? (c) How soon can the data be checked, coded, and computerized so as to allow early detection and correction of errors and omissions? (d) If blood is taken, should specimens of serum/plasma be kept deep-frozen for future analysis in case further hypotheses are suggested?
7. Tracing of subjects (a) How will the subjects be traced and when? (b) What secondary methods of tracing are available for subjects who cannot be traced by the primary methods? (c) What biases are likely to arise from incomplete tracing? 8. Collection of follow-up data(next page) 9. Analysis of data (a) Is a statistician (preferably the person who will undertake the analysis) involved in the design of the study? (b) What analyses of the data will be performed? 10. General considerations
8. Collection of follow-up data (a) After what interval(s) will follow-up data be collected? (b) What information will be required (repeat baseline data, outcome events, new tests)? (c) What checks should be made on the quality of the data to be collected (e.g. reproducibility, validity, comparability with the baseline data)? (d) Can we ensure that the outcome events are recorded 'blind' with regard to the initial observations? (e) If some subjects are not available (e.g. through migration or refusal), is there any useful information that we can obtain about them? 9. Analysis of data
10. General considerations (a) What ethical issues arise (e.g. concerning explanation and information given to subjects; signed consent forms for tests and follow-up procedures)? (b) What issues of professional etiquette must be considered (e.g. whose permission needs to be obtained; who should be informed as a courtesy)? (c) If the data collection could disclose abnormalities in the subjects (e.g. a high serum cholesterol), what is our criterion of abnormality and what do we do when we find it? (d) What are the costs of the study and what personnel will be required ? (next page)
(e) Is this the best time to start the study, or would it be better to wait (e.g. until the relevant technology has improved)? (f) Should the methodology of the study be made comparable to that of any other study (e.g. by using similar questionnaires)? (g) What experts should be consulted to increase the likelihood that the findings will be accepted as conclusive? (h) Is somebody keeping a list of all the people we promise to inform about the conclusions of the study?
Appendix II: Analysis of cohort studies (Clive Osmond) Cohort studies may be classified according to both the type of data that are collected at baseline and the nature of the eventual outcome measure. The combination determines the appropriate strategy for analysis. Below we consider four common combinations, mention the usual method of analysis, and give an example of each. (Table 14.2)
Design I Measurements are made on individuals. The outcome is the time to an event. The time may be censored (that is, the event is known not to have occurred up to the time specified). The usual method of analysis is by the Cox proportional hazards model. The effect size is measured by the hazard ratio, rather similar to a relative risk. Example Gale et al studied 730 elderly men and women who had completed a 7-day dietary record in 1973. They followed up the cohort for 20 years, noting when subjects died from stroke or other causes. Allowing for age, gender, and known cardiovascular risk factors, those who were in the highest third of vitamin C intake had a relative risk of 0.5 for stroke (95% confidence interval 0.3-0.8) compared with those in the lowest third. A similar gradient in risk was present for plasma ascorbic acid concentrations.
Design 2 Measurements are made on individuals. The outcome is a notionally continuous measurement. The usual method of analysis is by multiple linear regression and analysis of covariance. The effect size is measured by the regression coefficient. This assesses the change in the outcome variable for a unit change in a predictor variable. Thus when a predictor variable is binary the regression coefficient describes the contrast between two groups. Example Lucas et al. studied 502 pre-term babies who were randomized to receive one of two different diets during their early weeks - mature donor breast milk or pre-term formula.At age 18 months the survivors were given mental development assessments. A development score with mean close to 100 (standard deviation about 20) was obtained from each child. Regression adjustment was made for gender, gestational age, and social class. No clear difference in mental development was found between the two feeding groups.
Design 3 Measurements are made on individuals. The outcome is a binary 'yes/no' variable. The usual method of analysis is by multiple logistic regression. The effect size is measured by the regression coefficient, and this can be transformed into an odds ratio. Example Richardson and Baird studied the milk intake and calcium supplement use of a cohort of 9291 pregnant women in California. 268 women experienced pre-eclampsia, the 'yes/no' outcome variable in the study. Allowing for possible confounders such as number of previous pregnancies and body mass index, the odds ratio for pre-eclampsia was 1.9(95% confidence interval 1.2-2.9) in those who drank less than one glass of milk a day relative to those who drank two glasses of milk a day. The odds ratio was also higher(1.8; 95% Cl 1.1-3.0) in those who drank four or more glasses a day, again using as the comparison group the two glass drinkers. The authors interpreted the association of low levels of milk consumption with pre-eclampsia as consistent with data on calcium and hypertension. The association of high milk consumption with pre-eclampsia was unexpected. The authors suggested that it needed to be replicated.
Design 4 Comparisons are made at a group level. The outcome is a survival time (possibly censored). This is known at the individual level. Thus rates can be calculated for the groups. Age and gender standardization of rates is necessary. The analysis can be with an internal comparison group, when Poisson rates models are useful. An external comparison group, often implied by the use of national cause-specific mortality rates, leads to standardized mortality ratios as the measures of effect size. These are often scaled so that 100 corresponds to the rates in the external standard population. Example Thorogood et al studied 6115 members of the United Kingdom Vegetarian Society and 5015 of their meat-eating friends and relatives. The subjects were followed up for 12 years. Standardized mortality ratios (England and Wales = 100) for ischaemic heart disease were 51 (95% confidence interval 38-66) for the meat-eaters and 28 (20-38) for the vegetarians. Figures for all cancer were 80 (64-98) and 50 (39-62) for meat-eaters and vegetarians, respectively.
More complicated designs If repeated measurements are made on members of the cohort on different occasions,then it is inefficient merely to average the data and incorrect to regard all the observations as statistically independent. More appropriate models are needed, and it will almost certainly be necessary to seek statistical support. Indeed even the simpler designs carry their own subtleties, making it wise to work routinely in collaboration with a statistician.
Homework • 找一篇cohort study的文章 • 寫出 • 假說 • 研究對象 • 因(暴露變項)、果(疾病變項)的測量 • 測量了哪些干擾因素 • 有沒有測量偏差? • 追蹤其有多長? • 用什麼分析方法 • 結論 • 可能的解釋結果的alternative hypothesis