cohort design in Epidemiological studies
430 likes | 791 Vues
cohort design in Epidemiological studies. Prof. Ashry Gad Mohamed MBCh B, MPH, DrPH Prof. of Epidemiology Dr Amna R Siddiqui MBBS, MSPH, FCPS, PhD Associate Professor. Objectives. To describe the types of Cohort Study designs with their advantages and disadvantages

cohort design in Epidemiological studies
E N D
Presentation Transcript
cohort design in Epidemiological studies Prof. Ashry Gad Mohamed MBCh B, MPH, DrPH Prof. of Epidemiology Dr Amna R Siddiqui MBBS, MSPH, FCPS, PhD Associate Professor
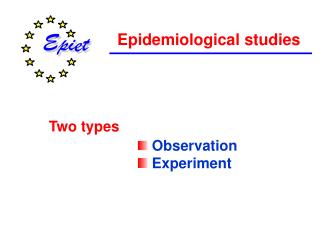
Objectives • To describe the types of Cohort Study designs with their advantages and disadvantages • 2. Calculate and interpret Relative Risk as measure of association. • 3. Illustrate the relationship of a confounder with exposure and outcome
WHAT IS COHORT • Ancient Roman military unit, A band of warriors. • Persons banded together. • Group of persons with a common statistical characteristic. [Latin] • E.g. age, birth date,
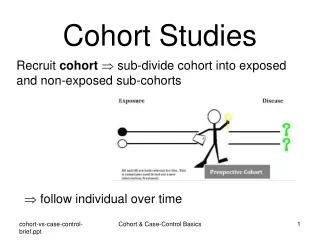
Anobservational epidemiological study in which we attempt to study the relationship between a proposed cause “exposure” and the subsequent risk of developing certain disease.
Do not develop the disease With the characteristic Sample free from the disease Develop the disease Reference population Develop the disease Without the characteristic Do not develop the disease
INDICATION OF A COHORT STUDY • When there is good evidence of exposure and disease. • When exposure is rare but incidence of disease is higher among exposed • When follow-up is easy, cohort is stable • When ample funds are available
Selection of cohort 1- Special exposure group • Unusual exposure to suspected causative factor e.g. nuclear explosion. • Unusual life style e. g. new migrants. • Unusual work experience e.g. new employers in silica industry.
General population sample where there is heterogeneity of exposure. • Groups of people selected because of administrative easee.g. insured persons, volunteers. • Geographicaldefined area e.g. Framingham study.
Selection of comparison group • Heterogeneous exposure No need for comparison group (internal comparison). • Homogenous group Need comparison group
Collection of baseline information: • Baseline information is important to assess exposure status. • Exclude diseased • Establish a basis for follow up. • Obtain data on the important co-variables e.g. age and sex.
Sources of information • Records. • Interview • Examination • Investigation
Interviews: • To interview the cohort members or other informatants through direct personal interview, mailed questionnaire, telephone interviews or computer administered questionnaire (e mail). • Wide variety of topics and allow asking complex questions. • However it is biased if the subject knows the aims of the investigation.
Examinations : • Repeated examinations and investigations are independent valid source of information • Sometimes it is the only method. • However it is expensive and time consuming and • Unless blindly performed it is usually biased.
. Follow upDuration of follow upIt depends on the length of induction period of the outcome in addition to the resources • It should fulfill the following • Uniform and complete for all participants. • Complete ascertainment of the outcome events. • Standardized diagnosis of outcome events
Outcome • Objective and explicit • Assessed blindly (diagnostic-suspicision bias & expectation bias) • Adjust for extraneous prognostic factors
Types of Cohort Study • Prospective cohort study • Retrospective (historical) cohort study • Combination of Retrospective and Prospective cohort study.
Advantages of Cohort Studies - Can establish population-based incidence - Accurate relative risk (risk ratio) estimation - Can examine rare exposures (asbestos > lung cancer) - Temporal relationship can be inferred (prospective design) - Time-to-event analysis is possible - Can be used where randomization is not possible - Magnitude of a risk factor’s effect can be quantified - Selection and information biases are decreased - Multiple outcomes can be studied (smoking > lung cancer, COPD, larynx cancer)
Disadvantages of Cohort Studies - Lengthy and expensive - May require very large samples - Not suitable for rare diseases - Not suitable for diseases with long-latency - Unexpected environmental changes may influence the association - Nonresponse, migration and loss-to-follow-up biases - Sampling, ascertainment and observer biases are still possible
ANALYSIS • Calculation of incidence rates among exposed and non exposed groups • Estimation of risk • Comparison of incidence proportion in both groups • Conceptually longitudinal to determine possible causal association between risk (exposure) and disease (outcome)
Incidence rates of outcome Disease Status Yes No Total Yes a b a+b Exposure Status No c d c+d N a+c b+d
Incidence rate • Incidence among exposed = a a+b • Incidence among non-exposed = c c+d
Estimation of risk • Relative Risk incidence of disease among exposed RR = ______________________________ Incidence of disease among non-exposed a/a+b = _________ c/c+d
Incidence of lung cancer among smokers 70/7000 = 10 per 1000 • Incidence of lung cancer among non-smokers 3/3000 = 1 per thousand RR = 10 / 1 = 10 (lung cancer is 10 times more common among smokers than non smokers)
Obesity & Diabetes RR= (43/412) / (29/630) =0.104 / 0.046 =2.26
Cohort study: Tobacco smoking and lung cancer, England & Wales, 1951 Source: Doll & Hill EPIET (www)
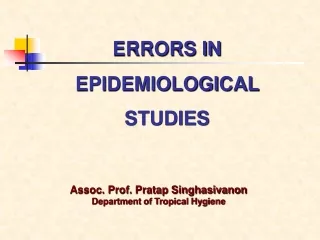
Causal Associations: Bias & Confounding • Need to consider the following when relating causality • Bias • Confounding Potential Biases in Cohort Studies • Non response • Loss to follow up with time • Measurement errors in exposure
Confounding • A confounding variable is one that is associated with the predictor variable, and a cause for the outcome variable • Confounding bias occurs when two factors are associated (travel together) and the effect of one is confused with or distorted by the effect of the other Exposure Disease
Outcome Outcome Exposure Exposure Confounder(s) Exposure - Outcome Model Simple Model Complicated Model
Confounding • The confounding variable is causally associated with the outcome / disease and • Non causally or causally associated with exposure but • Is not an intermediate variable in the causal pathway between exposure and outcome
Interpreting associations: Causal & Non Causal In truth only smoking is associated with Ca Pancreas • Causal (hypothesized) Coffee consumption Ca Pancreas • Non Causal (due to Confounding) Coffee consumption Smoking Ca Pancreas Real Association Spurious association Real Association Ref: MacMohan B. et al NEJM 1981 304:630-33