Download

1 / 39
390 likes | 595 Vues
CERAM February-March-April 2008. Class 4 Ordinary Least Squares. Lionel Nesta Observatoire Français des Conjonctures Economiques Lionel.nesta@ofce.sciences-po.fr. Introduction to Regression.

E N D
CERAM February-March-April 2008 Class 4Ordinary Least Squares Lionel Nesta Observatoire Français des Conjonctures Economiques Lionel.nesta@ofce.sciences-po.fr
Introduction to Regression • Ideally, the social scientist is interested not only in knowing the intensity of a relationship, but also in quantifying the magnitude of a variation of one variable associated with the variation of one unit of another variable. • Regression analysis is a technique that examines the relation of a dependent variable to independentor explanatory variables. • Simple regression y = f(X) • Multiple regression y = f(X,Z) • Let us start with simple regressions
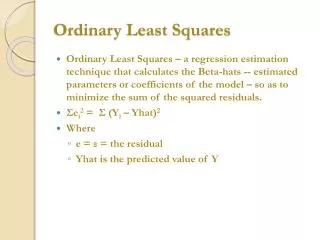
Objective of Regression • It is time to ask: “What is a good fit?” • “A good fit is what makes the error small” • “The best fit is what makes the error smallest” • Three candidates • To minimize the sum of all errors • To minimize the sum of absolute values of errors • To minimize the sum of squared errors
Problem of sign Y + – + X To minimize the sum of all errors Y – + – X
Problem of middle point Y +3 X To minimize the sum of absolute values of errors Y –1 +2 –1 X
Solve both problems To minimize the sum of squared errors Y – + – X
ε² ε To minimize the sum of squared errors • Overcomes the sign problem • Goes through the middle point • Squaring emphasizes large errors • Easily Manageable • Has a unique minimum • Has a unique – and best - solution
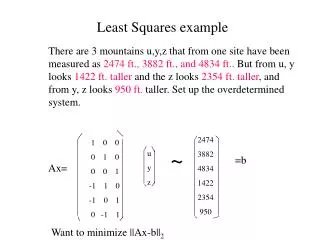
The Simple Regression Model • yi Dependent variable (to be explained) • xi Independent variable (explanatory) α First parameter of interest • Second parameter of interest • εiError term
ε² ε To minimize the sum of squared errors
ε² ε To minimize the sum of squared errors
Interpretation • When the log of R&D (per asset)increases by one unit, the log of patent per asset increases by 1.748 • Remember! A change in log of x is a relative change of x itself • A 1% increase in R&D (per asset) entails a 1.748% increase in the number of patent (per asset).
Application to Data using SPSS • Analyse Régression Linéaire
Assessing the Goodness of Fit • It is important to ask whether a specification provides a good prediction on the dependent variable, given values of the independent variable. • Ideally, we want an indicator of the proportion of variance of the dependent variable that is accounted for – or explained – by the statistical model. • This is the variance of predictions (ŷ) and the variance of residuals (ε), since by construction, both sum to overall variance of the dependent variable (y).
Coefficient of determination R² • R2 is a statistic which provides information on the goodness of fit of the model.
Fisher’s F Statistics • Fisher’s statistics is relevant as a form of ANOVA on SSfit which tells us whether the regression model brings significant (in a statistical sense, information. p: number of parameters N: number of observations
Application to Data using SPSS • Analyse Régression Linéaire
What the R² is not • Independent variables are a true cause of the changes in the dependent variable • The correct regression was used • The most appropriate set of independent variables has been chosen • There is co-linearity present in the data • The model could be improved by using transformed versions of the existing set of independent variables
Inference on β • We have estimated • Therefore we must test whether the estimated parameter is significantly different than 0, and, by way of consequence, we must say something on the distribution – the mean and variance – of the true but unobserved β*
The mean and variance of β • It is possible to show that is a good approximation, i.e. an unbiased estimator, of the true parameter β*. • The variance of β is defined as the ratio of the mean square of errors over the sum of squares of the explanatory variable
The confidence interval of β • We must now define de confidence interval of β, at 95%. To do so, we use the mean and variance of β and define the t value as follows: • Therefore, the 95% confidence interval of β is: If the 95% CI does not include 0, then βis significantly different than 0.
Student t Test forβ • We are also in the position to infer on β • H0: β* = 0 • H1: β* ≠ 0 Rule of decision Accept H0 is | t | < tα/2 Reject H0 is | t | ≥tα/2
Application to Data using SPPS • Analyse Régression Linéaire
Assignments on CERAM_BIO • Regress the number of patent on R&D expenses and consider: • The quality of the fit • The significance and direction of R&D expenses • The interpretation of the result in an economic sense • Repeat steps 1 to 3 using: • R&D expenses divided by one million (you need to generate a new variable for that) • The log of R&D expenses • What do you observe? Why?