Least Squares
By: Sean DuBois. Least Squares. What are Least Squares?. The method of least squares attempts to answer what linear line the data lies on. It can also be used to predict values. In other words it attempts to find the line of best fit. . Uses. Can be used to predict: gas prices


Least Squares
E N D
Presentation Transcript
By: Sean DuBois Least Squares
What are Least Squares? • The method of least squares attempts to answer what linear line the data lies on. It can also be used to predict values. • In other words it attempts to find the line of best fit.
Uses • Can be used to predict: • gas prices • health care expenditures • rate of inflation • number of cars used in a given country • Disease death rates • Percentage of people completing higher education • Etc
Squares Error To measure the error of the line, the sum of all points on the line is shown by the equation: + . . . .+ E is used to observe points that are fitted to the line. If the point lies on y=mx+b then the error of Ei is zero. If the given point is farther away from the line then the error of E will be higher.
Continued • In most cases the error will never be zero. The error can only be zero if the data points lie directly on a straight line, so in that case you need to figure the least squares line with the following equation:
Equation Continued • ∑x= sum of the x coordinates of the data points. • ∑y= sum of all the y coordinates • ∑xy= sum of the products • ∑ = sum of the squares of the x coordinates • N= number of data points
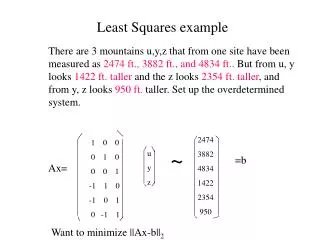
Example • The following data will be examined using least squares:
Example Continued • The first step involves finding the slope and y intercept of the data points supplied on the previous slide. • Once these have been found you can graph the data points and find the line of best fit.
Analysis • Looking at the graph you can see that gas prices are declining in New York City. The trend line shows this as it is linearly decreasing because of a negative slope.
Conclusions • Least Squares can be a simple method of figuring out trend lines by using data points. • It can be used to predict future prices of say gas or stocks. • With the example it showed that gas prices do not follow a linear trend because of outside variables such as a healthy economy.