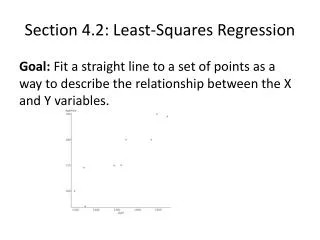
Least-Squares Regression
Least-Squares Regression. Correlation coefficient – r r describes the strength of the relationship In regression r 2 = fraction of variation in values of Y that is explained by X Example: The correlation between IQ and GPA was found to be a: r=0.50 b: r=0.99


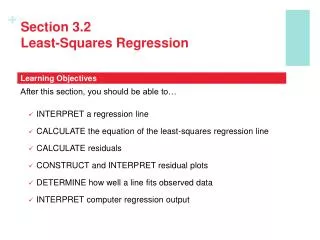
Least-Squares Regression
E N D
Presentation Transcript
Least-Squares Regression Correlation coefficient – r • r describes the strength of the relationship In regression • r2 = fraction of variation in values of Y that is explained by X Example: • The correlation between IQ and GPA was found to be • a: r=0.50 • b: r=0.99 • What percent of the observed variation in the students’ GPAs can be explained by IQ alone?
Least-Squares Regression What are the limits of r2? • r2 indicates the strength of a relationship just like r What is r2 when r = 1 What is r2 when r = -1 What is r2 when r = 0
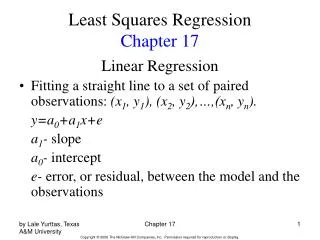
Least-Squares Regression • When developing a regression equation, it matters which is the explanatory and which is the response variable. • When calculating the equation we consider distances from the response variable to the line. • Reversing the roles will in turn produce different equations.
Residuals • Measure deviations from regression line • Vertical distances from the regression line Residual = Observed Predicted
Residuals Equation of relationship: Erosion = 1.461*Flow Rate + 0.04482 r = 0.943; r2 = 0.889 For Flow Rate = 2.5 l/s: What is the measured erosion rate? What is the predicted erosion rate? What is the residual? What does the sign of the residual tell you? R =
Residuals Residual Plots • Scatterplots of regression residuals against the explanatory variable.
Residuals • If regression line capture relationship between x and y, residuals should be random about the zero line. • Other residual plots….
Residuals • Curved pattern – relationship not linear • Straight line is not the best description of the relationship • Increasing or decreasing spread about the zero line as x increases • Prediction of Y will be less accurate as x increases • Individual points with large residuals • Outliers • Lie far from the line • Individual points extreme in x direction • Influential observations • Calculated residual not necessarily large
Regression and Correlation • Correlation causation • What does a good correlation value mean? • When results from observational study are all we have, in the absence of other evidence, we cannot attribute the relationship to causality