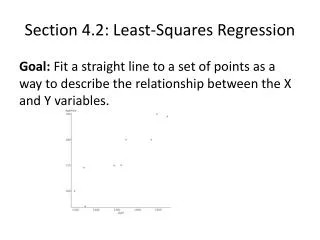
Least-Squares Regression
Least-squares regression is a statistical method that evaluates the relationship between two quantitative variables, providing insights into direction and strength. By fitting a straight line through data points, we summarize how a response variable (y) changes relative to an explanatory variable (x). This method allows us to predict y for given x values while requiring a distinct explanatory and response variable. An example involves predicting sons' heights based on fathers' heights using the least-squares regression line, which minimizes the vertical distances from points to the line.


Least-Squares Regression
E N D
Presentation Transcript
Least-Squares Regression • Correlation measures the direction and strength of a straight-line • (linear) relationship between two quantitative variables. • We have tried to summarize the data by drawing a straight-line • the through the data. • A regression line summarizes the relationship between two • variables. • These can only be used in one setting : when one variable helps • explain or predict the other variable.
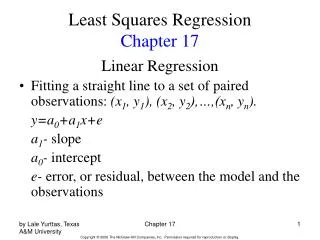
Regression Line • A regression line is a straight line that describes how a response • variable y changes as an explanatory variable x changes. We often • use a regression line to predict the value of y for a given value of • x. Regression, unlike correlation, requires that we have an • explanatory variable and a response variable. • If a scatterplot displays a linear pattern, we can describe the overall • pattern by drawing a straight line through the points. • This is called fitting a line to the data. • This is a mathematical model which we can use to make predictions • based on the given data.
Father’s Height Son’s Height Father’s Height Son’s Height 64 65 74 70 68 67 75 73 68 70 75 76 70 72 76 77 72 75 77 76 Example: Recall the data we were using before where we compared the heights of fathers and sons. The first thing we did was to plot the points.
76 72 Son 68 64 Father 64 68 72 76 Example: Recall the data we were using before where we compared the heights of fathers and sons. The line which is closest to all the points is the regression line.
Least-Squares Regression Line • The least squares regression line of y on x is the line that makes the • sum of the squares of the vertical distances of the data points from • the line as small as possible.
Equation of the Least-Squares Regression Line • Assume the mean for the explanatory variable is and the • standard deviation is • Assume the mean for the explanatory variable is and the • standard deviation is x y s s x y • Imagine we have data on an explanatory variable x and a response • y for n individuals. • Assume the correlation between x and y is r.
Equation of the Least-Squares Regression Line a + bx = y slope intercept b = r s y ( ) y x - b a = s x • The equation of the least-squares regression line of y on x is : The slope is b : The slope is a :
Example: What if we want to find the least-squares regression line where we will predict the son’s height from the father’s height ? Note: The father’s heights are the explanatory variable, and the son’s height is the response variable. We need the means and the standard deviations : The average of the x terms is 71.9 and the standard deviation is 4.25 The average of the y terms is 72.1 and the standard deviation is 4.07 The correlation between the two variables is 0.87
r = 0.87 = 71.9 = 4.25 = 4.07 = 72.1 a + bx 12.2 + .83x a + bx = = = y y y b = r s s y y ( ) 4.07 ( ) y x x y - b 0.87 a = s s 4.25 x x The equation for the regression line is : We need to find the slope : b = = 0.8331529 Next, find the intercept : a = 72.1 - (0.8331529)(71.9) = 12.196307 So, the equation for the regression line is :
Making Predictions 12.2 + .83x = y y A: = 12.2 + .83(70) = We can use the regression line to make some predicts. Example : Based on the previous data, we can predict the son’s height from the father’s height. Q: If the father’s height is 70 inches, what is our prediction for the son’s height? 70.1 Note: These predictions are only good on relevant data!!
12.2 + .83x = y 76 72 Son 68 64 Father 64 68 72 76
Notes On Regression • The point is always on the regression line. b = r s • The square of the correlation, , is the fraction of the variation • in the values of y that is explained by the least-squares regression • of y on x. y ( ) x y 2 2 r r s ( ) Example: The straight line relationship between father’s heights and son’s height is = (0.87) = 0.7569 explains the variation in heights. x , 2 • This equation says that a change of one standard deviation in x • corresponds to a change of r standard deviations in y.
Homework 33, 37, 39, 41, 43, 44, 46