Download

1 / 15
200 likes | 509 Vues
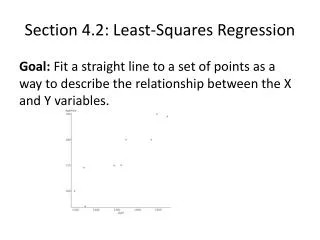
Least-Squares Regression. Residuals In most cases, no line will pass exactly through all the points in a scatterplot. A good regression line makes the vertical distances of the points from the line as small as possible. Definition:

E N D
Least-Squares Regression • Residuals In most cases, no line will pass exactly through all the points in a scatterplot. A good regression line makes the vertical distances of the points from the line as small as possible. Definition: A residual is the difference between an observed value of the response variable and the value predicted by the regression line. That is, residual = observed y – predicted y residual = y - ŷ Positive residuals (above line) residual Negative residuals (below line)
Least-Squares Regression • Least-Squares Regression Line Different regression lines produce different residuals. The regression line we want is the one that minimizes the sum of the squared residuals. Definition: The least-squares regression line of y on x is the line that makes the sum of the squared residuals as small as possible.
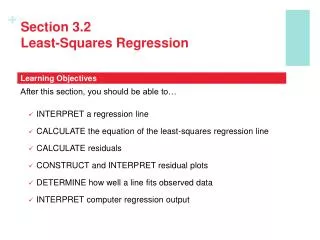
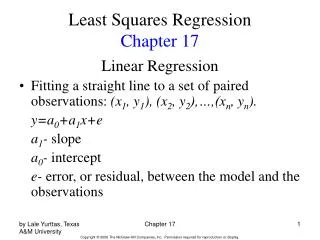
Least-Squares Regression • Least-Squares Regression Line We can use technology to find the equation of the least-squares regression line. We can also write it in terms of the means and standard deviations of the two variables and their correlation. Definition: Equation of the least-squares regression line We have data on an explanatory variable x and a response variable y for n individuals. From the data, calculate the means and standard deviations of the two variables and their correlation. The least squares regression line is the line ŷ = a + bx with slope and y intercept
Least-Squares Regression • Residual Plots One of the first principles of data analysis is to look for an overall pattern and for striking departures from the pattern. A regression line describes the overall pattern of a linear relationship between two variables. We see departures from this pattern by looking at the residuals. Definition: A residual plot is a scatterplot of the residuals against the explanatory variable. Residual plots help us assess how well a regression line fits the data.
Least-Squares Regression • Interpreting Residual Plots A residual plot magnifies the deviations of the points from the line, making it easier to see unusual observations and patterns. • The residual plot should show no obvious patterns • The residuals should be relatively small in size. Pattern in residuals Linear model not appropriate Definition: If we use a least-squares regression line to predict the values of a response variable y from an explanatory variable x, the standard deviation of the residuals (s) is given by
Least-Squares Regression • The Role of r2 in Regression The standard deviation of the residuals gives us a numerical estimate of the average size of our prediction errors. There is another numerical quantity that tells us how well the least-squares regression line predicts values of the response y. Definition: The coefficient of determination r2 is the fraction of the variation in the values of y that is accounted for by the least-squares regression line of y on x. We can calculate r2 using the following formula: where and
Least-Squares Regression • The Role of r2 in Regression r 2 tells us how much better the LSRL does at predicting values of y than simply guessing the mean y for each value in the dataset. Consider the example on page 179. If we needed to predict a backpack weight for a new hiker, but didn’t know each hikers weight, we could use the average backpack weight as our prediction. SSE/SST = 30.97/83.87 SSE/SST = 0.368 Therefore, 36.8% of the variation in pack weight is unaccounted for by the least-squares regression line. 1 – SSE/SST = 1 – 30.97/83.87 r2 = 0.632 63.2 % of the variation in backpack weight is accounted for by the linear model relating pack weight to body weight. If we use the LSRL to make our predictions, the sum of the squared residuals is 30.90. SSE = 30.90 If we use the mean backpack weight as our prediction, the sum of the squared residuals is 83.87. SST = 83.87
Least-Squares Regression • Interpreting Computer Regression Output A number of statistical software packages produce similar regression output. Be sure you can locate • the slope b, • the y intercept a, • and the values of s and r2.
Least-Squares Regression • Correlation and Regression Wisdom Correlation and regression are powerful tools for describing the relationship between two variables. When you use these tools, be aware of their limitations 1. The distinction between explanatory and response variables is important in regression.
2. Correlation and regression lines describe only linear relationships. Least-Squares Regression • Correlation and Regression Wisdom 3. Correlation and least-squares regression lines are not resistant. Definition: An outlier is an observation that lies outside the overall pattern of the other observations. Points that are outliers in the y direction but not the x direction of a scatterplot have large residuals. Other outliers may not have large residuals. An observation is influential for a statistical calculation if removing it would markedly change the result of the calculation. Points that are outliers in the x direction of a scatterplot are often influential for the least-squares regression line.
4. Association does not imply causation. Least-Squares Regression • Correlation and Regression Wisdom Association Does Not Imply Causation An association between an explanatory variable x and a response variable y, even if it is very strong, is not by itself good evidence that changes in x actually cause changes in y. A serious study once found that people with two cars live longer than people who only own one car. Owning three cars is even better, and so on. There is a substantial positive correlation between number of cars x and length of life y. Why?
Section 3.2Least-Squares Regression Summary In this section, we learned that… • A regression line is a straight line that describes how a response variable y changes as an explanatory variable x changes. We can use a regression line to predict the value of y for any value of x. • The slope b of a regression line is the rate at which the predicted response ŷ changes along the line as the explanatory variable x changes. b is the predicted change in y when x increases by 1 unit. • The y intercept aof a regression line is the predicted response for ŷ when the explanatory variable x = 0. • Avoid extrapolation, predicting values outside the range of data from which the line was calculated.
Section 3.2Least-Squares Regression Summary In this section, we learned that… • The least-squares regression line is the straight line ŷ = a + bx that minimizes the sum of the squares of the vertical distances of the observed points from the line. • You can examine the fit of a regression line by studying the residuals (observed y – predicted y). Be on the lookout for points with unusually large residuals and also for nonlinear patterns and uneven variation in the residual plot. • The standard deviation of the residuals smeasures the average size of the prediction errors (residuals) when using the regression line.
Section 3.2Least-Squares Regression Summary In this section, we learned that… • The coefficient of determination r2 is the fraction of the variation in one variable that is accounted for by least-squares regression on the other variable. • Correlation and regression must be interpreted with caution. Plot the data to be sure the relationship is roughly linear and to detect outliers and influential points. • Be careful not to conclude that there is a cause-and-effect relationship between two variables just because they are strongly associated.
Looking Ahead… In the next Chapter… • We’ll learn how to properly design studies to produce data. • We’ll learn about • Sampling and Surveys • Experiments • Using Studies Wisely