Least-Squares Regression Computations
130 likes | 163 Vues
Learn how to analyze mixed costs through scattergraph plots and least-squares regression in Microsoft Excel, determining average fixed and variable costs per meal served at Matrix, Inc. Use SLOPE, INTERCEPT, and RSQ functions to calculate important regression analysis metrics.

Least-Squares Regression Computations
E N D
Presentation Transcript
Least-Squares Regression Computations Appendix 2A
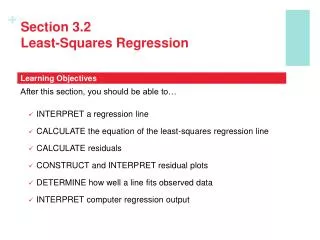
Learning Objective 2-8 Analyze a mixed cost using a scattergraph plot and the least-squares regression method.
Simple Regression Analysis Matrix, Inc. wants to know its average fixed cost and variable cost per meals served. Using the data to the right, let’s see how to do a regression using Microsoft Excel.
Simple Regression Using Excel • You will need three pieces of information from your regression analysis: • Estimated Variable Cost Per Unit (line slope) • Estimated Fixed Costs (line intercept) • Goodness of fit, or R2 To get these three pieces information we will need to use three Excel functions. SLOPE, INTERCEPT, and RSQ
Place your cursor in cell F4 and press the = key. Click on the pull down menu and scroll down to “More Functions . . .” Simple Regression Using Excel
Simple Regression Using Excel Scroll down to the “Statistical” functions. Now scroll down the statistical functions until you highlight “SLOPE”
Simple Regression Using Excel 1. In the Known_y’s box, enter C4:C19 for the range. 2. In the Known_x’s box, enter D4:D19 for the range.
Simple Regression Using Excel Here is the estimate of the slope of the line. 1. In the Known_y’s box, enter C4:C19 for the range. 2. In the Known_x’s box, enter D4:D19 for the range.
Simple Regression Using Excel With your cursor in cell F5, press the = key and go to the pull down menu for “Special Functions.” Select Statistical and scroll down to highlight the INTERCEPT function.
Here is the estimate of the fixed costs. Simple Regression Using Excel 1. In the Known_y’s box, enter C4:C19 for the range. 2. In the Known_x’s box, enter D4:D19 for the range.
Simple Regression Using Excel Finally, we will determine the “goodness of fit”, or R2, by using the RSQ function.
Here is the estimate of R2. Simple Regression Using Excel 1. In the Known_y’s box, enter C4:C19 for the range. 2. In the Known_x’s box, enter D4:D19 for the range.