Download
1 / 15
150 likes | 268 Vues
Telling the Full Story – . How Detailed Data Analysis Reveals the True Face of Suburban Poverty PART 2. September 26, 2013 Presented by: Michael L. Hanley Empire Justice Center Rochester, New York mhanley@empirejustice.org. The New York Times Census Project:

E N D
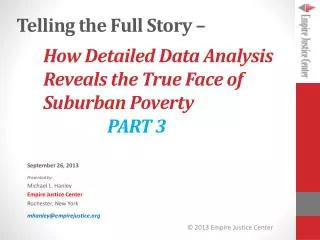
Telling the Full Story – How Detailed Data Analysis Reveals the True Face of Suburban Poverty PART 2 September 26, 2013 Presented by: Michael L. Hanley Empire Justice Center Rochester, New York mhanley@empirejustice.org
The New York Times Census Project: http://projects.nytimes.com/census/2010/explorer
The New York Times Census Project: http://projects.nytimes.com/census/2010/explorer • “INCOME” MAPS: • Household Income Distribution • Median Household Income • Change, Median Household Income • Households Earning Under $30,000 • Households Earning Over $200,000
The New York Times Census Project: http://projects.nytimes.com/census/2010/explorer • “HOUSING AND FAMILIES” MAPS: • Median Home Value • Change in Median Home Value • Median Monthly Rent • Change in Median Monthly Rent • Mortgages Consuming 30% of Income • Same Sex Couples
The New York Times Census Project: http://projects.nytimes.com/census/2010/explorer • EDUCATION MAPS: • High School Graduates • Bachelor’s Degree or Higher • Master’s Degree or Higher • Elementary Students in Private Schools
The New York Times Census Project: http://projects.nytimes.com/census/2010/explorer • “RACE AND ETHNICITY” MAPS: • Racial/Ethnic Distribution • White Population • Black Population • Hispanic Population • Asian Population • Foreign Born Population
“Rich Blocks, Poor Blocks” website: http://www.richblockspoorblocks • Similarly, the “Rich Blocks, Poor Blocks” website has some helpful free online maps. • These can give you a quick look at where wealth variations are, and what issues might be relevant. (The data is mapped at the census tract level.) • “INCOME” maps are free, • “POVERTY” maps have a small fee.
“Rich Blocks, Poor Blocks” website: http://www.richblockspoorblocks • If time permits, we can look at more maps from the “Rich Blocks, Poor Blocks” website to see how patterns of poverty concentration vary: • Los Angeles, CA • Chicago, IL • Phoenix, AZ • St. Louis, MO • San Francisco, Oakland, Berkeley, CA • Detroit, MI • Baltimore, MD • Boston, MA • New York City, NY
So, where’s the detailed data? • The basic Datasets: Keep in mind the difference between the Decennial Census; the Consumer Survey, and the American Community Survey (five year vs. one year data) • 68 poverty tables with 5 year ACS Data, including-- S1701: Poverty Status (All Persons) -- numbers and percents above or below poverty level given by age, sex, race/ethnicity, education, employment status, and includes numbers at certain percentages of poverty S1702: Poverty Status (Families) -- For All families; Married; Female HH no husband – gives race/ethnicity; workers; SSI; education; family size, etc B17022: Ratio of Income to Poverty Level of Families by Family Type (Married; Female HH w/no husband; Male HH w/no wife) grouped by ages of children B17026: Ratio of Income to Poverty Level of Families – (good increments: e.g., under 50% of Poverty; at Poverty; 100 to 200% in breaks; 3x, 4x, over 5x)
Comparing counties and the central city within ametropolitan area:
Comparing Suburban Towns to the Central City Within an Urban County
Comparing Suburban Towns (combined)to the Central City Within an Urban County
ACS 5-year data -- Table S 1701: Numbers and Percentages Above or Below Poverty Level in the Past 12 Months
Contact Information: Michael L. Hanley Empire Justice Center Rochester, New York mhanley@empirejustice.org