Download

1 / 9
130 likes | 356 Vues
Stake holders conference. Prediction models for site specific fertilizer recommendations View point of fertilizer industry. Aug 25, 2012. Nadeem Tariq Sr GM Agri Biz. Situation analysis. Fertilizer price increase is higher than commodities in 2011

E N D
Stake holders conference Prediction models for site specific fertilizer recommendations View point of fertilizer industry Aug 25, 2012 Nadeem Tariq Sr GM Agri Biz
Situation analysis • Fertilizer price increase is higher than commodities in 2011 • Farmers ability to buy fertilizers decreased, lead to: • Reduction in N and P use • Widening N:P ratio • Higher land use efficiency to meet increasing population needs • Financial impact on national exchequer from wheat alone • 1 maund / acre wheat yield contributes 24 B Rs • Lower fertilizer use may reduce yield by 10 – 15% • Potential loss to GDP can be 72 – 96 B Rs • Food security may be compromised leading to higher crime rate and serious law & order situation Catastrophic situation, calls for serious focus to enhance fertilizer use efficiency
Urea Price impact Price (Rs/bag) kt Consumption 4.9 5.5 6.5 6.1 (-6%) 5.9 (-3%) 3.1 (-1%) • Consumption was growing with stable price till 2009 • Bumpy ride started from 2010 • Installed production capacity reached 6.9 million tons • Gas supply curtailed by GOP from 2010 and almost stopped in 2012 • Production losses lead shortage and market price increase • Imports not aligned with consumption, maximum product arrived after peak • Higher price affected farmers’ buy-ability leading to lower consumptions
DAP Price impact kt Consumption Rs/bag 1.4 0.8 1.8 1.3 1.1 0.3 • DAP off take has strong correlation with price and acceptance by farmers • 2007 Oct – Nov : price was 1.4 k Rs/bag and off takes were 202 and 335 kt • 2008 : Nominal sales between Mar – Sep at 2.7 – 3.0 k Rs/bag. Situation changed with wheat price to 950 Rs/40 kg and DAP off take were 484 kt in 4Q even at 3.1 k Rs/ bag • 2010 : Farmers resisted to 2,000 + price level in 3Qs. Factors for higher sales in 4Q • Impact of increasing international price put fear of even higher price • Higher Cotton price improved farmers ability to invest in wheat • 2011 and 12 : Farmer response to 3.7 - 3.9 k Rs/bag has been very poor
Land use efficiency • Increasing LUE and yields, Lower fertilizer use : more mining of nutrients • Depleted soils require higher fertilizer to even maintain yield levels • Higher fertilizer price forced famers to further reduce dose • Improving fertilizer efficiency and balance application seems better option
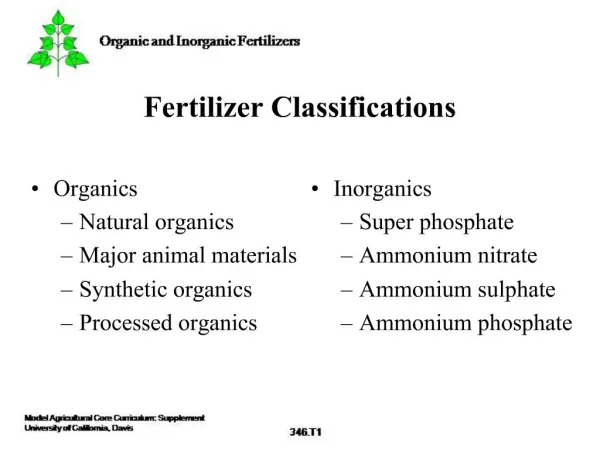
N:P Ratio analysis • Recommended NP ratio 1:0.50 • Urea and DAP taken, being highest volume products in N & P Remedy Balance use and higher use efficiency, quick & economical
Nitrogen use efficiency China Kg India Pakistan • Research by International Fertilizer Association • Indicator : kg grains produced with each kg of N used
Correlation • Wheat production is directly affect by P fertilizers sales • P sales declined in 07-08 resulted in lower wheat production despite 18% higher N fertilizers sales
Conclusion • Countries are generously investing to enhance use efficiency • E-Chopal is one such example • Invested over 1 B IRs to develop GPS base soil fertility map • Now facility available to famers at their farms spontaneously • Excellent step forward by Dr A Rashid and his team • Best use of in-house resources • Humble start with negligible investment • Potential to become knowledge hub for farmers and change fertilizer use habits leading to higher productivity • Request authorities to provide maximum support to meet current challenges of Food Security • Funds to expand crop and geographical base • Cordial information sharing by all departments