Transonic Facility
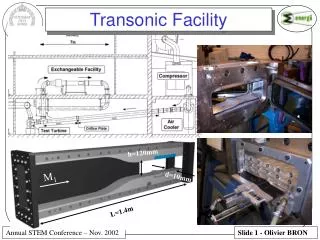
This study presents a comprehensive analysis of transonic flow over 2D and 3D bump geometries using experimental and numerical methods. The facility setup includes a test section with dimensions h=120mm and L=1.4m, examining various conditions (M1 = 0.90%, 0.80%, and 0.50%). We provide detailed illustrations of experimental results alongside Schlieren animations that visualize the flow behavior. Additionally, we perform a numerical-experimental comparison using 3D RANS k-ω simulations to validate the findings.

Transonic Facility
E N D
Presentation Transcript
Transonic Facility h=120mm M1 d=10mm L=1.4m
Illustration of Experimental Results on 2D Bump M1 Miso 90% 80% M1 50% Std (Ps) M1 M1 50% 90% Click On Picture For Schlieren animation
Illustration of Experimental Results on 3D Bump M1 M1 M1 M1 Click on Pictures for Schlieren animation
Numerical-Experimental Comparison on 2D Bump 3D RANS k- Simulation Steady State Experiments 90% 50% 90% 50%