HYDROGEN HELICONS
370 likes | 395 Vues
Explore the design considerations and plasma power deposition of hydrogen helicons in the Medusa permanent-magnet system. Discuss the implications of lower hybrid frequency, ion motions, and energy loss rates. Gain insights into hydrogen and argon behavior in plasma discharges.

HYDROGEN HELICONS
E N D
Presentation Transcript
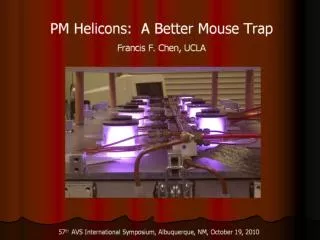
HYDROGEN HELICONS In the Medusa permanent-magnet system Part 1: Preliminary considerations Part 2: Design for high density Part 3: Design for low density Francis F. Chen, UCLA, October, 2008
Hydrogen helicons in Medusa 2 tube The lower hybrid frequency w(LH) is 6.5 times higher for H than for Ar and is not <<w(RF). To neglect ion motions, need to have w(RF) >> w(LH). Need to decrease B to have lower w(LH), but low B means bad coupling, like ICPs. Since k is same if we keep 2” diam tube, we have to increase w(RF) and change n and kz.
Meaning of the lower hybrid frequency The lower hybrid frequency wLH is given by where Wp is the ion plasma frequency. The last term is negligible except at very low density, so wLH is proportional to B/M. In simple helicons, w is >>wLH and Wc, so the ions cannot move with the RF. When wLH approaches wRF, the ions will move and contribute to the helicon current. Scime et al. have seen increased ion temperatures when w ~ wLH, but HELIC does not show any great effect there. At wLH, the ion and electron orbits to B look like this: The blue line is the ion cyclotron orbit, which has been distorted by the LH wave. The red line is the orbit of the electron guiding-center E x B drift. The cyclotron orbits of the electrons is too small to see.
Hydrogen RnB scans for 13.56 MHz No stable solution for hydrogen. Here, H is distance from antenna to endplate.
Hydrogen RnB scans for 27.12 MHz There are stable solutions, but n has to be high, requiring LOTS of power.
Radial deposition profiles There is not much difference between 13 and 27 MHz. The TG peak at the edge is wider than for argon, probably because the radial group velocity of the TG waves is faster for hydrogen.
Compare hydrogen at 27.12 MHz with argon at 13.56 MHz to get an idea of how the discharges behave in the standard 2” diam tube H is essentially the tube length
How does the power deposition look in normal Ar discharges? Here P(z) and P(r) are the power deposition profiles in z and r, and P(k) is the power spectrum. The cases are at two low-field peaks, and the spectrum is almost a pure mode. The dashed line is the location of the antenna.
This compares the profiles for argon and hydrogen in the same 2 x 2” tube and at the same conditions: B = 50G and n = 3 x 1011 cm-3. However, f = 13.56 MHz for argon and 27.12 MHz for hydrogen.
Calculation of plasma loss rate (1) The energy needed to replace each electron-ion pair lost to the wall is F.F. Chen and J.P. Chang, Principles of Plasma Processing (Kluwer, 2003), pp. 71-72 Here Ec is the energy needed to perform each ionization, including other inelastic losses incurred in the process. 2KTe is the average energy carried out by each electron. The ion energy carried out consists of the Bohm energy at the sheath edge, ½KTe, and the sheath drop, about 5KTe. The power lost is Wtot times the particle flux to the walls. Here ½n is the density at the sheath edge, n being the peak density. This assumes few collisions. At higher pressures, the edge density will be even lower. Ions go out at the Bohm velocity cs, which is the acoustic velocity. S is the total area of the tube, including top, bottom, and sides. The required RF power is then
Calculation of plasma loss rate (2) If Ec were the same for hydrogen as for argon, the loss rate would be 40 times higher for H than for Ar, since cs varies as M-1/2. For a tube 2” is diameter by 2” long, Prf works out to be Prf (W) = 1.7 10-10n (Argon) = 1.210-9n (Hydrogen) They are, of course, proportional to n.Ec will be discussed on the next page. The power delivered to the plasma is less than Prf because of the circuit resistance Rc. See F.F. Chen and H. Torreblanca, Plasma Sources Sci. Technol. 16, 593 (2007). If Rp<Rc, Pin follows the low-field peak curve, as on the left, and there is the possibility that the loss line will not intersect the Pin curve. But if Rc> ~3W, Pin is almost all of Prf, as on the right. Then there is an operating point regardless of how large Ec is.
Calculation of plasma loss rate (3) The calculation of Ec involves summing up all the inelastic-collison energy that an electron loses, on the average, before it ionizes an ion. Most of the energy is lost to radiation of spectral lines after the electron raises an atom to an excited state. For argon, this function of Te was computed by Vahid Vahedi in his Ph.D. thesis under Prof. C.K. Birdsall of Berkeley. It is given for Ar, O, and O2 by Lieberman and Lichtenberg, 2nd ed., p. 82. It has probably not been computed for other gases. An ionization coefficient measured in gas discharges is given on the next page. It shows that hydrogen is harder to ionize in spite of the fact that it has a lower ionization potential. Thus, the loss line for hydrogen may be steeper than for argon for two reasons: faster loss rate and slower ionization. This is the reason that more power is required to achieve a given density for hydrogen than for argon. However, ionization of hydrocarbon molecules would be easier than for pure hydrogen.
Ionization coefficient in gas discharges S.C. Brown, Basic Data of Plasma Physics (AIP Press, 1994). (reprint of 1959 original) Hydrogen The coefficient h is the number of ionizations an electron makes after traveling through a voltage drop of 1 V. It is a function of E/p, in (V/cm)/torr. These scans were resized so that the horizontal scales are the same, and the vertical scales end at 0.02. The blue line is where the hydrogen graph starts. Note that hydrogen needs a higher E-field to start, but it reaches its peak at about the same E/p as argon. However, these data assume much higher pressures than mTorrs. The ionization potentials are 15.7 eV for argon and 13.5 eV for hydrogen.
HYDROGEN HELICONS Part 1: Preliminary considerations Part 2: Design for high density Part 3: Design for low density Francis F. Chen, UCLA, October, 2008
Redesign of helicon tubes for hydrogen operation • Tube I.D. ~ 5 cm, antenna ID ~7 cm, as before, unless otherwise specified. • The gap of 2 cm is slightly less conservative than assumed before. • RF frequency assumed to be 27.12 MHz • H is the distance between the antenna midplane and the conducting or insulating endplate. • Assumed 15 mTorr, KTe = 3 eV, n(r) given by s = 4, t = 1, fa = 0.3.
Loading resistance vs. n and B curves for varying H In all cases, highest B is best. The conducting endplate is much better than the insulating ones.
RnB curves vs. H at B = 140G. For insulating endplates, H = 2.5” is best. Loading is higher for conducting endplates H = 1.5” is best. It seems to be a pure mode with the highest loading. We therefore choose this case for further analysis.
Power deposition profiles for two very different cases P(r) is dominated by the TG mode and does not vary much. P(z) peaks near the antenna (dashed line in each case). High P near endplate is not good, since plasma created there is lost fast. The k-spectrum is pure for H = 1.5” but has other modes for H = 3.5”, as seen by the wiggles in the RnB curve on the last page.
Comparison of waves in 1.5 in. and 3 in. long tubes The short tube has higher P(z), but it is high near the endplate. The electric field |Ez|, however, fits properly , whereas it is too short for the 3” tube. The maximum of Ez at the endplate causes strong reflection, which gives a higher low-field peak. Thus, the short tube is better even though a lot of useless ionization occurs near the endplate. This shows that computing Ez may be the best way to fit the tube length to the half-wavelength of the helicon wave and optimize the loading.
Magnet design This is the external field of NdFeB ring magnets 3” ID x 5” OD x t” thick. The 2” magnet can be made by stacking two 1” magnets. The rectangle shows where the 1.5” long discharge tube can be placed to have ~140G at the antenna. The upper left corner of the rectangle shows the B-field at the endplate. The position z is measured from the midplane of the magnet.
Match circuit design We calculate the values of C1 and C2 to make sure they are reasonable. Except for the parameter that is being varied, we assume; f = 27.12 MHz L = 0.39 uH (2-turn antenna); R = 2 W N = 4 tubes; matching is easier with more tubes. Z1 = Z2 = 30 cm
A 3-turn antenna has L ~ 0.88 mH. So a 2-turn antenna should have L ~ 0.88 (2/3)2 ~ 0.39 mH. This is within range. This shows insensitivity to R. The limit for Z2 is OK for 4 tubes. 8 tubes far apart may be a problem. No problem with Z1.
Increase tube diameter to 3 inches Here we try a larger tube to get better loading. The scans for H = 3” do not look good, but at H = 2”, there is a good peak at 100G and n = 5 x 1011 cm-3, where R = 2.5W. The profiles for this case show a large Ez at the endplate, but the minimum is at the antenna. Therefore, the constructive interference occurs downstream, and Pz maximizes outside the tube.
Matching of 2-turn antenna for 3” diam tube If a 3-turn, 2” diam antenna has L = 0.88mH, a 2-turn, 3” diam antenna has L = (0.88)(2/3)2(3/2)=0.59 mH. This is within the range of this diagram for 4 tubes, the same as shown before.
HYDROGEN HELICONS Part 1: Preliminary considerations Part 2: Design for high density Part 3: Design for low density Francis F. Chen, UCLA, October, 2008
Design of helicon system for low-density hydrogen operation • Since hydrogen is harder to ionize, competing systems probably run at lower density than in argon. • We therefore assume n = 2 x 1011 cm-3 and try to optimize the system for that density. The density at the substrate will be in the mid 1010 range. • RF frequency assumed to be 27.12 MHz • H is the distance between the antenna midplane and the conducting endplate. Insulating endplate is not as good. • Assumed 15 mTorr, KTe = 3 eV, n(r) given by s = 4, t = 1, fa = 0.3. Francis F. Chen, UCLA, October, 2008
What can we vary? We wish to lower n from our previous optimum, but we don’t want to increase f beyond 27.12 MHz because power supplies are harder to get, and lumped-circuit matching may not be possible. Also, we don’t want to decrease B because of lower coupling efficiency. We can decrease k by increasing the tube diameter, and decrease kz by increasing H. To lower n by an order of magnitude from 2E12 to 2E11, we can try to increase a from 2” to 6” and H from 2” to 6”. We shall find that the best solution is not quite that.
Try to optimize constructive interference From now on, we assume a 6” tube diameter. Here, all cases seem good, with a deep minimum showing good reflection and maxima at the two ends of the tube.
Scan for low-field peak for various tube lengths Here we try to get a peak at n = 2E11. Three possibilities are H = 3” @ 100G, H = 4.5” @ 140G, and H = 7” @ 70G. R is much higher than in last slide.
Axial profiles for the three best cases @ 2x1011 cm-3 The best loading (R > 7W) occurs when the wave profiles do not show large maxima and minima. The 7” long tube has good resonances, but R < 5W. The surprising result is that a short tube with H = 3” at 100G is best because it requires a relatively low field.
Magnet design This is the external field of NdFeB ring magnets 7” ID x 10” OD x t” thick. The large rectangle shows where the 4.5” long tube can be placed to have ~140G at the antenna for t = 6”. The smaller rectangle is for a 3” tube, 100G, and t = 4”. The horizontal line is for a 7” tube, 70G, and t = 3”. Only the 3” tube is practical.
Match circuit design We calculate the values of C1 and C2 to make sure they are reasonable. Except for the parameter that is being varied, we assume; f = 27.12 MHz L = 0.29 uH (1-turn antenna); R = 6 W N = 4 tubes; matching is easier with more tubes. Z1 = Z2 = 30 cm
Antenna and match circuit design A 3-turn antenna has L ~ 0.88 mH, measured previously. A 2-turn antenna still has too much inductance with a 6” diameter. Hence, we must use a 1-turn antenna with inductance 0.29 mH, which is 0.88*3/32. These curves are for 4 tubes and 27.12 MHz.
Voltage and current in one antenna The voltage and current to each antenna can be large before breakdown, when Rp = 0 and R = Rc ~ 0.5W. Here are the values for 400W applied to a single antenna.
Comparison of 3 optimized systems of different diameters For hydrogen at 27.12 MHz Tube: 6” diam, 3” high Magnet: 7 x 10”, 4” high Tube: 2” diam, 1.5” high Magnet: 3 x 5”, 2” high Tube: 3” diam, 2” high Magnet: 4 x 6”, 2” high
Conclusion The six-inch diameter system is too large to be practical. In addition to the larger magnets required, the distance between the sources and the substrate has to be increased to achieve plasma uniformity. At low densities helicon discharges have no advantage over ICPs*. If densities higher than in ICPs are useful, then the Medusa system with either 2-in. or 3-in diameters can be designed to give good performance. The 2-in. system is easiest to make and is more compact, but the 3-in. system has higher plasma resistance and is more likely to make the circuit losses negligible. * However, this HELIC calculation at 1G (B = 0 would diverge) for the Medusa 2 tube and antenna shows very poor plasma resistance at 27.12 MHz in hydrogen.