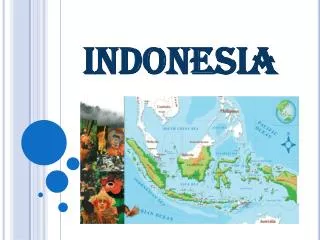
INDONESIA
INDONESIA. Economic growth. Consumer spending accounted for 55 % of gross domestic product in 2011; the comparable figure for China in 2010 was 35 %.

INDONESIA
E N D
Presentation Transcript
Economic growth Consumer spending accounted for 55 % of gross domestic product in 2011; the comparable figure for China in 2010 was 35 % Indonesia’s annual growth surged from zero in 1998 to 6.4 % in 2011, swelling the number of middle-class consumers by 50 million to more than 130 million, according to the World Bank. The number of Indonesian billionaires doubled in the past year alone, bringing the total up to 21individuals sharing a total combined wealth of over $55 billion.
Our Experience across the region We have conducted brand audits, developed digital media strategy, performed social monitoring & community management for clients like:
Digital Overview : ADMA 2012 Marketing Yearbook Why do Indonesian Users go online? 73% - to get inspired 70% - Education 69% - Stay up to date demonstrates a thirst for knowledge
E-commerce: ADMA 2012 Marketing Yearbook What do Indonesian Users buy online? 17% - Clothes 15% - Travel 12% - Books Early stages of e-commerce behavior
US Online Advertising Spendto Exceed Print for the First Time in 2012 China Online Advertising Spendto Exceed Print for the First Time in 2012
How they’re connecting 180,000,000+mobile phones in Indonesia. 210,000,000+ sim connections. 36% smartphone penetration in cities. 22% Smartphone penetration nationwide. 60% of phone penetration will be smart (Nielsen estimates for 2013)
How connected? • Significant FB user Growth YoY • 42million in April 2012 • 48 million in April 2013 • Predicted 79 million by 2015 • Greater Jakarta ranks as #1 world city with 17.4 million accounts (80% penetration). • Internet usage between 20 – 40% of population (48 – 100 million) • Twitter ranks Indonesia as 4th in World with 29 million accounts
How they’re connecting Some background numbers… • Blackberry • growth 2011 – 2012 YoY 35% • currently 42% market share • 60% of total internet access now through mobile • 87% of tweets come from a mobile device Some estimated socio-economics… • by 2020 • 117 million under 25 (43% of total population) • 52% or 130 million people will be urban.
Who’s most connected 6.8 million 5.1 million 8.9 million 4.2 million 17.4 million
The most connected • Twitter – Agnes Monika @agnezmo – 7.2 million followers • Facebook - Mario Teguh – 7 million Fans
The most connected Brand – Blackberry ID – 6.8 million FB fans
Whats fuelling the growth? • Social & collectivist society as a culture. Already sharing with extended families & communities offline. • Travel restrictions around cities due to congestion means catching up with friends & family is sometimes easier digitally. • Shared interests are powerful new tools of relating to others & meeting new people geographically • Telco’s focused on promoting FB & Twitter as ‘Free Services’ & bundling into all new emerging phones.
What is social media? Content : Our ‘curation’ of Blogs, video, photos &text • Youtube: 60 hours of video uploaded every minute • 1 out of every7minutes spent online is on Facebook • 300 million pics are uploaded to INSTAGRAM every day Communications : Changes in how that content is shared • Every minute700 videos are shared through twitter • Every minute 100,000tweets are sent • Pinterest is now 3rdmost popular social site in the US • 91% of mobile internet access is for social use http://www.mediabistro.com/alltwitter/100-social-media-stats_b33696
Trust The voice of fellow consumers continues to be strongly heard when it comes to the most trusted forms of advertising. 92% of consumers around the world say they trust earned media, such as word-of-mouth or recommendations from friends & family, above all other forms of advertising.
Mis-Trust • Government, Police, Media Institutions over past 40 years. • Democracy often labeled ‘demo-crazy • True freedom of press & public expression only 10 years old. • He harbours misgivings about an American-style, unfettered access to the Internet. At the same time, he emphatically rejects the model of China, which routinely blocks sites like Facebook & Twitter. • “I think we are between China & the United States,” he said. “Yes, we are free. But with freedom comes responsibility.”
Mis-Trust People do not trust the government, according to the 2013 annual global survey conducted by the Edelman Trust Barometer released in February. Respondents said that they had less trust in “the government” than the private sector, the media and NGOs. More than 1,000 Indonesians were interviewed for the survey, 77percent of whom said that they trusted the media, versus 74percent for business, 51 percent for NGOs and 47percentgovernment. The writer teaches journalism at the Dr.Soetomo Press Institute (LPDS) in Jakarta http://www.thejakartapost.com/news/2013/04/16/media-owners-please-stay-out-newsroom.html
What role does social media play? 1% 9% 90%
Content drives awareness Recent Tourism campaign on Y! ID In May 2011 4 destination articles were released onto Y! Travel through Frontpage… Also Published on Y!’s Social sharing channels Twitter & FB. Results… Pages loaded: 919,177 times Ads clicked: 8,368 times Social engagement: 15,682
Readership = Interest Recent Tourism campaign on Y! ID Article #1 Lake Taupo(28/3-10/4)PV: 236,141UU: 172,350 Time spent: 3.94 mins/UUTwitter share: 125FB share: 2719FB like: 1875FB comments: 2039 Recommendations: 62 Article #2 Queenstown (11/4-24/4)PV: 97,314UU: 68,009 Time spent: 3.88 mins/UUTwitter share: 107FB share:106FB like: 60FB comments: 109 Recommendations: 21 Article #3 Rotorua(25/4 -8/5)PV: 351,125UU: 239,140Time spent: 3.98 mins/UUTwitter share: 69FB share: 1566FB likes: 972FB comments: 497 Recommendations: 16 Article #4 Auckland (9/5-22/5)PV: 193,299UU: 134,950Time spent: 3.98 mins/UUTwitter share: 127FB share: 2017FB like: 1372FB comments: 1749 Recommendations: 74
AIA in Social Media Fans gained – 61,786 YouTube videos watched – 48,971 Twitter followers – 1,534 Likes/Shares/comments – 413,512
Aus Tourism NZ Tourism FB vs 4,100,000 total fans 1,200,000 Australian fans 43,000 Indonesian fans 773,000 total fans 166,000 New Zealand fans 4,400 Indonesian fans
If you’re interested http://socialmedianz.com/opinion2/2011/11/11/putting-the-social-back-into-indonesia%E2%80%99s-media/ http://socialmedianz.com/opinion2/2012/03/11/one-facebook-page-or-many-a-dilemma-for-brands/
Q & A Thank you for listening! David Chalklen Twitter: @davechalklen Email: davec@vocanic.com Blog: www.thepowerofinfluence.com LinkedIn: http://id.linkedin.com/in/davidchalklen